
Checkout optimization: the four fields that kill orders
Four structural checkout leaks — extra fields, late costs, payment gaps, trust failures — each with a revenue cost you can calculate tonight.

Your checkout page is where the money leaves. Checkout optimization is not about redesigning your cart — it is about locating the four structural problems that account for most of the drop and assigning a dollar amount to each one.
The average checkout flow contains 11.3 form fields across 5.1 steps, according to Baymard Institute's 2024 usability benchmark. Seventeen percent of US online shoppers have abandoned an order specifically because the checkout process was too long or complicated. That number sits on top of an already bleak baseline: 70.22 % of shopping carts are abandoned before purchase.
Four problems drive most of it. Each one is measurable. Each one has a cost you can calculate tonight with your own session and order data.
Checkout optimization is the process of removing friction from four structural leaks: unnecessary form fields, costs revealed late, missing payment methods, and trust gaps at the point of payment. Each leak has a calculable revenue cost. The average checkout has 11.3 fields; an ideal flow can run in eight or fewer.
Key takeaways
- Seventy percent of shopping carts are abandoned before purchase; 17% specifically cite checkout complexity. The problem is measurable: four structural leaks drive most dropoffs, each with calculable revenue cost.
- Unnecessary form fields beyond eight create dropout risk. A single-percentage-point improvement from removing one field generates €8,160 in annual revenue on a 300K-session baseline.
- Late-cost revelation at payment step is the top abandonment driver. Missing payment methods and trust gaps at payment are equally quantifiable but invisible without auditing checkout as customer.
- A 5-point improvement in checkout completion—from 25% to 30%—recovers €18,360 in gross margin annually with no increase in traffic, advertising, or acquisition cost.
- Open your GA4 funnel, identify your worst drop-off step, count form fields and payment methods, then calculate monthly friction cost using the formula to determine if optimization outweighs ad spend.
The four leaks — and what each one costs
Most stores have all four. They compound: a shopper who hits late shipping costs and then sees only one payment method and no trust signals does not complete the order. The cost is not additive — it is multiplicative. Where the revenue actually leaves across the full store is a longer story, but the checkout is the chapter with the sharpest numbers.
Leak one: unnecessary fields
Baymard's 2024 benchmark found that the typical checkout asks for 11.3 fields when an optimized flow needs eight or fewer. Each extra field is a decision point — and a dropout risk.
Take the worked store: 300,000 sessions a year, €68 average order, 1.0 % conversion. That is 3,000 orders and €204,000 in revenue per year. Of those sessions, 4 % reach the checkout — 12,000 a year — and 25 % of them complete. If removing one unnecessary field lifts checkout completion by a single percentage point — a conservative estimate — that is 120 additional orders and €8,160 in extra revenue annually. On 45 % gross margin, the retained contribution is €3,672 per year. Per extra field beyond the minimum your fulfilment process actually needs.
You do not need to know the exact elasticity. You need your drop-off rate at the form step in GA4, and you need to count your fields.
Leak two: costs revealed late
Shipping fees, taxes, or handling charges that appear for the first time at the payment step are the single largest driver of abandonment. Baymard's research consistently places unexpected extra costs at the top of stated reasons why shoppers leave without buying.
The cost model here is the same but concentrated: if late-cost exposure accounts for 20 % of your checkout drop-offs — a number you can read directly from your funnel — and your checkout reach rate is 4 %, the recoverable segment is real. Every point of checkout completion you recover on those 12,000 checkout sessions at €68 is €8,160 in annual revenue.
The fix is not hiding fees. It is surfacing them before the shopper starts typing. That is a product decision, not a design one.
Leak three: payment method gaps
Your customer is ready to buy. The payment method they trust is not there. They close the tab.
This leak is invisible in most Shopify dashboards because it leaves no data: no error, no abandoned cart event, just a session that ends at the payment step. The only way to find it is to run the checkout as a customer — on the device your customers actually use, with the payment method they expect — and see what is missing.
That is what Flamel does in the audit: we place a real order, with a real card, on the actual device, then read your Shopify admin to cross-reference payment method uptake against your customer geography. A missing local payment method in a market that represents 15 % of your sessions is not a small gap.
Leak four: trust failures at the point of payment
A shopper who is uncertain about returns, security, or delivery timing does not ask — they abandon. Trust signals are not decoration; they are answers to the questions your checkout does not ask out loud.
The cost is harder to isolate because trust affects the whole funnel, not just the payment step. But it is measurable: look at your exit rate on the payment page versus your exit rate on the information step. If the delta exceeds 10 percentage points without a fee or field explanation, trust is the variable doing the work — or failing to. For the reference store: 12,000 sessions reach checkout, so a 10-point delta at the payment step is 1,200 sessions leaving over doubt alone. At the store's 25 % completion rate, recovering half of them is 150 additional orders — €10,200 in revenue and €4,590 in gross margin, from answering questions the page never asked out loud.

What checkout optimization costs this store — and yours
Assign numbers across all four leaks for the blog's reference store: 300,000 sessions per year, €68 average order, 1.0 % conversion, 45 % gross margin. The goal is not precision — it is to show that the order of magnitude is worth the attention.
Current state
  Sessions/year:          300,000
  Conversion rate:          1.0 %
  Orders/year:              3,000
  Revenue/year:          €204,000
  Gross margin (45 %):    €91,800

Checkout reach: 4 % of sessions; 25 % of those complete the purchase
  Sessions reaching checkout:    12,000
  Orders completed:               3,000
  Checkout completion rate:        25 %

If checkout completion rises from 25 % to 30 %:
  Additional orders:                600
  Additional revenue:           €40,800
  Additional gross margin:      €18,360
That 5-point improvement in checkout completion is a 20 % relative lift, against the 35.26 % increase Baymard documents as achievable through better checkout design — a figure measured on large US and EU retailers — Walmart, Amazon, ASOS and others in the same tier — whose checkouts are already tuned. It is worth €18,360 in annual gross margin. Without one more visit, one more ad, one more influencer post.
The session does not cost more. The customer has already decided to buy. The checkout is just the last place the store gets in its own way.
Checkout optimization: what to do by Monday
Open your GA4 funnel report for the last 30 days. Find the step where the largest drop occurs between "reached checkout" and "purchase". Count your form fields on that step. Count the number of payment methods visible on mobile. Then run this:
Cost of your checkout leak (monthly) =
  (Monthly sessions) × (checkout reach rate) × (drop-off at that step)
    × (% attributable to friction) × (your checkout completion rate) × (AOV)
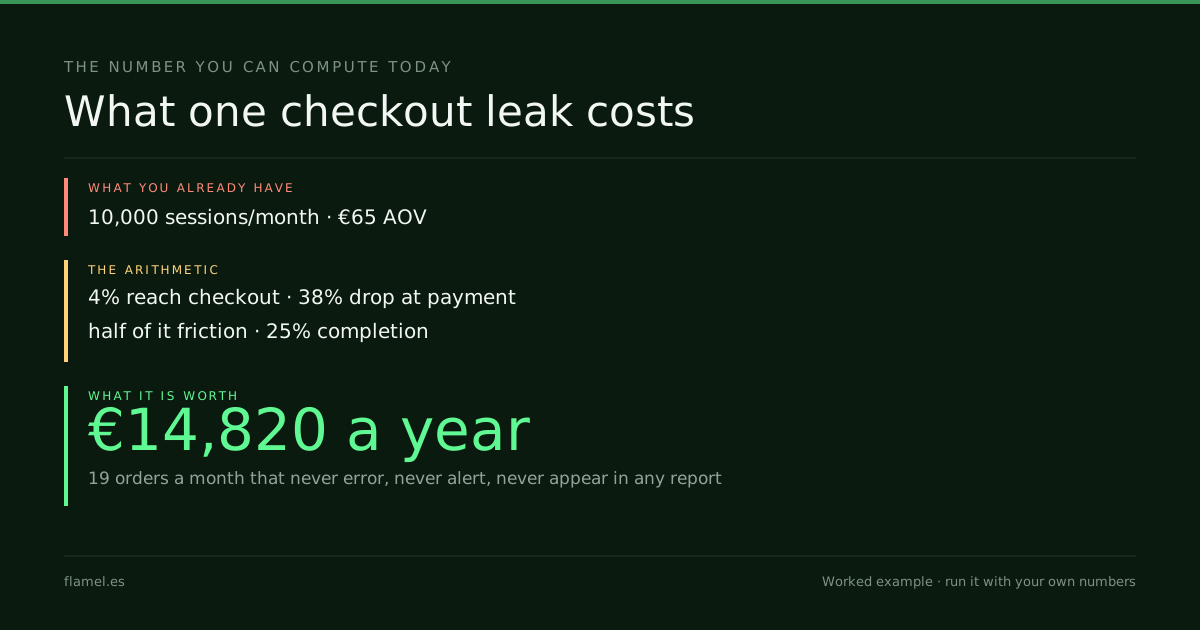
For a store doing 10,000 sessions a month with a €65 AOV, a 4 % checkout reach rate, a 38 % drop-off at the payment step — where half that drop is friction-driven — and a 25 % completion rate on the sessions it recovers, the monthly cost is:
10,000 × 0.04 × 0.38 × 0.50 × 0.25 × €65 = €1,235/monthThat is €14,820 a year, on a store that never sees the loss because nothing errors. Run it with your own sessions and AOV. If it exceeds $500, you know what the next conversation costs.
The product page leak, the post-purchase gap, and the repeat purchase design each carry their own calculation — and each is its own post, coming soon. The checkout is the one that hits hardest because the decision has already been made. Your customer just did not finish.
It is almost never one big problem. It is four small ones compounding.
Work through this with your own numbers
You are the owner of a DTC ecommerce store. Your GA4 shows [monthly sessions], [average order value], [checkout reach rate as %], and [worst step drop-off rate as %]. Of that drop-off, estimate [percentage you believe is friction-driven, not intent-driven]. Your current checkout completion rate is [current completion %]. Calculate the monthly revenue loss from friction using this formula: (sessions) × (checkout reach rate) × (drop-off %) × (friction share) × (current completion rate) × (AOV). Then determine: at what completion rate improvement would optimization ROI exceed your typical monthly ad spend? What changes most—form fields, late cost timing, payment methods, or trust signals—if you reduced monthly friction cost by 50%?FAQ
What is a good checkout conversion rate for a Shopify store?
Checkout conversion rate — the share of sessions reaching checkout that complete a purchase — varies by category and traffic source. Baymard Institute's research shows the average cart abandonment rate sits around 70 %, implying roughly 30 % completion. A well-optimized store with low-friction fields, transparent fees, and broad payment methods can push that meaningfully higher. The number to benchmark against is your own funnel, not an industry average.
What are the main reasons customers abandon the checkout?
Baymard's usability research identifies four structural causes: unexpected extra costs appearing at the payment step, a checkout that feels too long or complicated (11.3 fields on average), missing payment methods, and a lack of trust signals at the point of payment. Each has a measurable revenue cost you can calculate from your own GA4 funnel drop-off data and average order value.
How many form fields should a Shopify checkout have?
Baymard's 2024 benchmark found the average checkout asks for 11.3 fields across 5.1 steps. An optimized flow can complete a transaction in eight fields or fewer. Every field beyond that is a decision point and a dropout risk. The right number is the minimum your fulfilment process requires — not what the default theme ships with.
Can I calculate what my checkout abandonment rate is costing me?
Yes. Formula: (monthly sessions) × (checkout reach rate) × (drop-off rate at the worst step) × (estimated friction share) × (your checkout completion rate) × (average order value). For a store with 10,000 monthly sessions, a €65 AOV, 4 % checkout reach, 38 % drop-off at payment where half is friction-driven, and a 25 % completion rate, the monthly cost is roughly €1,235 — €14,820 a year. Run the same formula on your own GA4 data tonight.
How do I reduce cart abandonment on a Shopify store without a developer?
Start with two low-dev changes: surface shipping costs and fees before the payment step, and audit which payment methods appear on mobile. Removing optional fields in Shopify's checkout editor also requires minimal technical work. The highest-value move is diagnosing which of the four structural leaks — fields, late costs, payment gaps, or trust failures — is costing the most before deciding where to spend development time.
That's what The Conversion Audit is. Five business days, $500, and the map is yours whether or not you hire us.
Your store, five days.
$500. Zero commitment. Yours either way.