
Ecommerce conversion rate optimization: where the revenue actually leaves
Conversion is rarely one big leak. It's four small ones that multiply — and the arithmetic tells you which to fix first, using three numbers you already have.

Most stores go looking for the leak, and most stores are looking for the wrong shape of thing.
They expect one hole: a broken step, a bad button, a page that everybody bounces off. Something that shows up in analytics wearing a sign. That store exists, but it's rare, and if you had it you'd have found it already.
What is actually happening is smaller and worse. Four modest losses, none of them alarming on its own, sitting in a row where they multiply rather than add. That structure is why conversion work feels unrewarding when you attack it piecemeal, and it's also why it pays so well when you don't.
Key takeaways
- Your conversion rate is a multiplication of four steps, not a sum; 10% loss at each step compounds to losing a third of revenue without breaks showing.
- Mobile converts at 40% of desktop rate across Spanish stores—if your mobile is less than half your desktop, the leak is located: that's your problem.
- Product pages leak when they don't answer the five questions customers ask most (fit, materials, delivery, returns, real appearance); discovery requires clicks that send buyers to competitors.
- Checkout leaks come from unnecessary fields, forced account creation, and missing payment methods—if fewer than two-thirds complete checkout, that's your priority for the week.
- Improving three steps by 10% each multiplies your conversion rate by 1.331; apply this to your sessions, conversion rate, and AOV to calculate annual revenue already in the building.
Conversion is a product, not a number
Your conversion rate is the last line of a multiplication. A visitor has to reach a product, decide it answers their question, put it in a basket, survive the total, and finish paying. Miss any one and the sale is gone — which means the rate you report is the product of every step, not the sum.
That has an unfortunate consequence and a useful one.
The unfortunate one: a 10% loss at four steps isn't a 40% problem, it's the difference between 1.00 and 0.66. Two thirds. You lose a third of everything without a single step ever looking broken.
The useful one runs the same way. Improve three steps by 10% each — not double them, improve them by a tenth — and you have multiplied by 1.331. That is a 33% increase in orders, from three changes that each sound too small to bother with.
It also explains why conversion work has a reputation for disappointing. A team picks the step that looks worst, fixes it properly, and the headline rate moves by a tenth of a point — so the project gets shelved as not worth it. The fix was fine. The mistake was doing one of them, because a multiplication with one improved term barely moves and a multiplication with three improved terms moves a third.
This is the whole reason the CAC arithmetic points where it does. In that post, the example store moved 0.4 points of conversion and gained €81,600 a year without a single extra visitor. Here is the same 0.4 points, taken apart: three ten-percent steps in a row. Nothing heroic in any of them.
The benchmark that tells you whether this applies to you
Before the four, one number for calibration.
Across 1,265 Spanish digital businesses, the average ecommerce conversion rate is 1.22% (Flat 101, Estudio Anual de Conversión). Mobile carries 66% of the traffic and converts at 0.82%; desktop converts at 2.02%.
Read the second half of that twice. Two thirds of your visitors are arriving on the device that converts at 40% of the rate of the other one. Not a rounding difference — a factor of two and a half.
So the four leaks below are not evenly distributed. In almost every store we open, they are concentrated on a screen that is 390 pixels wide, and the desktop version of the same shop is fine. If your mobile rate is less than half your desktop rate, you can stop reading generic advice: that gap is your conversion problem, and it has a location.

Leak one — the product page answers the wrong questions
A product page has one job: answer every question standing between a visitor and a decision, in the order the questions arrive.
The questions are almost always the same. Will this fit me. What is it actually made of. When does it arrive. What happens if I get it wrong. What does it look like on someone who isn't a model.
What most pages do instead is describe. They lead with a paragraph about the brand's story, put the delivery estimate in a collapsed accordion below the fold, and mention returns on a policy page in the footer. Nothing is missing, exactly. It is just that the buyer has to go and find it, and finding it takes them to a tab where your competitor is one search away.
The diagnostic is cheap: write down the five questions your customer service answers most often. If any of them cannot be answered from the product page without a click, that's a leak, and it's costing you the people too polite to email you.
Photography is the same argument in a different medium. A visitor cannot touch the thing, so the images are doing the work your hands would do in a shop: scale, texture, how it behaves on a real body in ordinary light. A gallery of five studio angles on white answers one question five times and leaves the other four open.
Leak two — the cart, where the total stops being the price
The second loss happens in the four seconds after a visitor sees the real total.
Shipping appears. Sometimes tax appears. Occasionally a handling fee appears, which is the worst of all because it has no story. The price they had accepted in their head is not the number on the screen, and the gap did its work invisibly — they don't complain, they close the tab.
None of this means shipping must be free. It means the total must stop being a surprise. A shipping cost stated on the product page costs you the sales it was always going to cost. The same cost revealed at the cart costs you those plus everyone who felt handled.
Where it gets interesting is the threshold: the number you set for free delivery decides your average order value in both directions, and most stores pick it by copying a competitor rather than by calculating it. That is its own post, and it's coming.
Leak three — the checkout, which is a queue you built
Checkout is where the buyer has already decided and you are still asking. Every field is a small delay with a small chance of ending the sale, and the fields multiply exactly like everything else here.
Three specifics carry most of the loss. Fields you don't need — company name, second address line, a phone number you never call. Account creation before purchase, which asks someone to start a relationship in order to complete a transaction. The missing payment method, which is the quiet killer in Spain and Latin America both, because the buyer who wants Bizum, or cash on delivery, or the local wallet, and doesn't find it, is not a lost sale you can win back with a discount. It's a wall.
Fixing a checkout is unglamorous and it converts better than nearly anything else you can do with the same week, because everyone who reaches it has already said yes.
It is also the one leak where the evidence is already sitting in your own data. Your checkout knows how many people started and how many finished, and the ratio between those two is a number nobody has to argue about. If it is under two thirds, the week is decided for you.
Leak four — the return trip, which multiplies the other three
The fourth is not a conversion problem at all, and that's why it gets left out of conversion projects and why leaving it out is expensive.
The first three change how many visitors become customers. The fourth changes what a customer is worth once you have one, and it does it multiplicatively as well. If a customer buys twice instead of once, every euro you spent acquiring them bought twice the revenue, and the first three leaks were worth twice what you thought.
The mechanics are ordinary: the confirmation email that arrives when it says it will, the delivery that matches the estimate, a first unboxing that doesn't feel cheaper than the website did, and one well-timed reason to come back. Almost none of it is design work. All of it is inside the same funnel.
We rebuilt one store's experience around this — the whole thing is written up here — and the number that matters isn't the peak. It's that conversion sat at 4.4% across 22 months and 130,465 sessions, and stayed above 3.4% while traffic more than doubled. Rented traffic stops when you stop paying. A fixed funnel keeps working on visitors you haven't bought yet.
What the four are worth, in your numbers
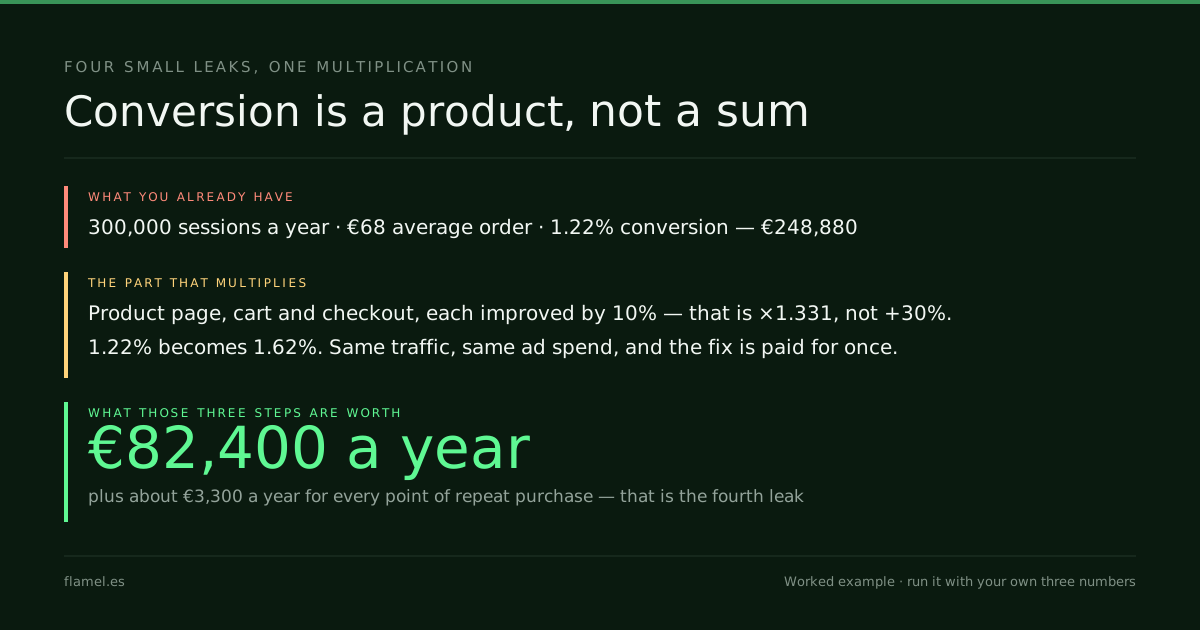
Take the same store as the CAC post: 300,000 sessions a year, €68 average order value. At the Spanish average of 1.22%, that is 3,660 orders and €248,880 a year.
Now improve three steps by 10% each. Not the whole funnel — three steps, a tenth each.
1.22% × 1.331 = 1.62%. That's 4,871 orders instead of 3,660, and €82,400 a year in revenue that was already in the building. The traffic is identical. The ad spend is identical. You paid for the fix once and it applies to every visitor who arrives afterwards, including the ones you're renting.
And the fourth leak, priced separately because it works on a different quantity: at 4,871 customers, every single point of repeat-purchase rate is worth about €3,300 a year. Ten points is a second Christmas.
Your version of that calculation needs three numbers you already have: sessions, conversion rate split by device, and average order value. Multiply, then multiply again by 1.331 and look at the difference. That gap is what the four leaks are currently costing you, and it is almost always larger than the last quarter's ad budget.
When this isn't your problem
Three cases, so this isn't a sales pitch with the exceptions removed.
Under about 1,000 sessions a month, your conversion rate is noise. Ten orders instead of seven is not a 43% improvement, it's a Tuesday. At that volume the honest work is demand, not optimisation.
Already above your category benchmark, the four leaks are sealed well enough and the money is elsewhere — in margin, in what you sell, in who you sell it to. Pushing conversion from good to excellent costs more per point than the first points did.
And if your product is bought on impulse by people who already know you, the funnel is short by design and there is not much to fix. Traffic is your business. Buy it.
Everyone else: the default has flipped. Fewer visitors are arriving, they convert worse on the device most of them use, and replacing them costs more every quarter. The four leaks are the cheapest inventory you own.
What to do by Monday
Open analytics and write down three numbers: sessions, conversion rate split by device, and average order value. Multiply the three. That's your baseline, and it is probably the first time it has been on one line.
Then walk your own store on your own phone, with a card in your hand, and buy something. Count the questions you couldn't answer from the product page. Count the fields at checkout. Notice the moment the total changed. You will find three of the four leaks in eleven minutes without opening a single report.
The fourth one you find by asking how many of last year's customers bought twice.
If you'd rather have someone else do the walk and hand you the map, that's what the Conversion Audit is. Five business days, $500, and the map is yours whether or not you hire us.
Work through this with your own numbers
You are a DTC ecommerce owner optimizing your store's conversion funnel. You have [monthly sessions], a conversion rate of [desktop conversion rate]% on desktop and [mobile conversion rate]% on mobile, and an average order value of [AOV in your currency]. Calculate your baseline annual revenue from current conversion. Then apply a 1.331 multiplier (three 10% improvements across the funnel) to your conversion rate and recalculate annual revenue. Show the gap. Also calculate what one point of repeat-purchase rate is worth annually at your improved customer volume. Based on these numbers, which leak should you prioritize first—product page clarity, cart transparency, checkout fields, or repeat purchase mechanics—and why?Your store, five days.
$500. Zero commitment. Yours either way.