
LTV CAC ratio: why 3:1 is the wrong target for most stores
The 3:1 LTV:CAC ratio is borrowed from SaaS. For a DTC store with thin margins and slow payback, it quietly masks a cash-flow problem. Here is the math.

Every benchmark says aim for 3:1. The LTV CAC ratio has one number attached to it so universally that most store owners repeat it without running it against their own margin. That number came from SaaS, where customers pay monthly under contract. Your store does not have a contract. What the ratio means — and what target is actually sustainable — depends on your contribution margin, not on a benchmark borrowed from a different business model.
The arithmetic takes five minutes. It ends with a minimum ratio you can calculate with your own numbers this afternoon, and a payback window that tells you how long each euro of acquisition cost is tied up before it comes back. Both numbers change what you should be willing to spend on the next customer.
If you would rather be walked through the questions than look them up yourself, paste this into ChatGPT or Claude. It returns the same numbers this post works through, on your own store.
You are a DTC ecommerce analyst. Work out my minimum LTV:CAC ratio, my actual ratio and my payback period.

Ask me one at a time, waiting for each answer: average order value; orders per customer over the last 12 months; gross margin %; variable fulfillment cost per order; variable marketing cost per order; total acquisition spend over the last 12 months, including salaries, retainers, tools and first-order discounts; new customers acquired in that period, customers not orders.

Estimate nothing I have not given you. If I do not know a number, tell me which one is missing and stop.

Then show every line of the arithmetic:
contribution margin % = gross margin % - (variable fulfillment + variable marketing) / AOV
honest LTV = AOV x orders per customer x contribution margin %
minimum LTV:CAC = 1 / contribution margin %
blended CAC = acquisition spend / new customers
actual ratio = honest LTV / blended CAC
maximum sustainable CAC = honest LTV / minimum ratio
payback months = blended CAC / (AOV x contribution margin % x monthly order frequency)

End on one line: above or below my floor, and the yearly gap as (minimum ratio - actual ratio) x blended CAC x new customers.
The LTV CAC ratio measures how much lifetime value a customer generates per euro spent acquiring them. The 3:1 benchmark originates in SaaS, where contractual retention is assumed. For a DTC store with a 40–45% contribution margin and no guaranteed repeat purchase, the sustainable minimum is 2.2:1 to 2.5:1 — and payback period matters as much as the ratio.
Why 3:1 arrived from the wrong model
Stripe's guide to SaaS unit economics covers the LTV/CAC ratio as a core health metric for subscription businesses and cites 3:1 as the standard target: for every dollar spent acquiring a customer, the goal is to earn three back over the life of that relationship. The logic holds when customers pay monthly under contract and churn is predictable.
A DTC store assumes nothing of the sort. Repeat purchase is designed for — or left to luck. There is no contract. There is no guaranteed month two. When you drop a 3:1 target into that context, you are borrowing the confidence of a business model you do not have.
That is not a theoretical problem. It is an arithmetic one.
What the honest LTV looks like
The blog uses one continuous store as its worked example so the arithmetic is consistent: 300,000 sessions a year, €68 average order value, 45% gross margin, 1.6 orders per acquired customer over twelve declared months, 1.0% conversion rate.
The honest LTV — measured on real customers with a declared window — runs like this:
Honest LTV = AOV × repeat orders × gross margin
           = €68 × 1.6 × 0.45
           = €49
At a 3:1 ratio, that €49 LTV is permission to spend €16 per acquired customer. Nothing more.
Now check what that means in practice. If your blended CAC — total acquisition spend divided by new customers — is €30, your ratio is 1.6:1. You are spending nearly twice what the math allows at 3:1. The margin does not catch up; the payback never arrives.
The inflated read — LTV measured on survivors, without a declared window, no margin factored in — gives €163 for the same store. At 3:1 that becomes permission to spend €54 per customer. The store feels like it is scaling. The bank account disagrees. Why the two figures diverge by that much is its own post, and it's coming — but the short answer is: most LTV calculations measure the customers who stayed, not all the customers who arrived. The longer version is in the LTV post, which walks the calculation from the first order.
How payback period changes the math
The ratio tells you whether unit economics are net positive. The payback period tells you when they turn positive — which is the number that drives cash flow.
Payback period in months:
Payback (months) = CAC ÷ (AOV × contribution margin % × monthly order frequency)For the worked store, with a CAC of €25 and 1.6 orders over twelve months (0.13 orders per month) — using gross margin (45%) as a proxy for CM% here, since the variable cost split has not yet been applied:
Payback = €25 ÷ (€68 × 0.45 × 0.13)
        = €25 ÷ €3.98
        = 6.3 months
Six months to recover a single acquisition. Every euro spent on paid channels in January is not working until July. If you over-spend on acquisition in Q4, you may not recover those euros before the year closes.
A store with a shorter payback — higher AOV, higher margin, faster repeat — can afford a lower LTV:CAC ratio and stay solvent. A store with a long payback needs a higher ratio as a buffer against cash pressure. The 3:1 benchmark accounts for none of this. It does not know your payback window and it does not adjust for your margin.

The minimum LTV CAC ratio your margin actually requires
Here is the number that replaces the borrowed benchmark. It starts from contribution margin percentage (CM%) — revenue minus COGS, minus variable fulfillment, minus variable marketing — not gross margin alone.
Minimum ratio formula:
Minimum LTV:CAC = 1 ÷ CM%If your CM% is 30%, your minimum is 3.3:1 — you need more than 3:1 just to break even on acquisition at that margin, before overhead.
If your CM% is 45%, your minimum is 2.2:1. A 2.5:1 ratio gives a real, if thin, buffer.
If your CM% is 20%, your minimum is 5:1. A business running 3:1 at that margin is losing money on every customer it acquires, quietly, at scale.
The 3:1 target is the right answer for a 33% contribution margin. The 3:1 benchmark assumes a 33% contribution margin — a number most DTC stores do not hit exactly: some run higher, many run lower. The benchmark adjusts for none of them. (If your own numbers put you at exactly 33%, 3:1 is the right floor. The point is that the benchmark assumes a margin it never states.)
On one store, what the number says
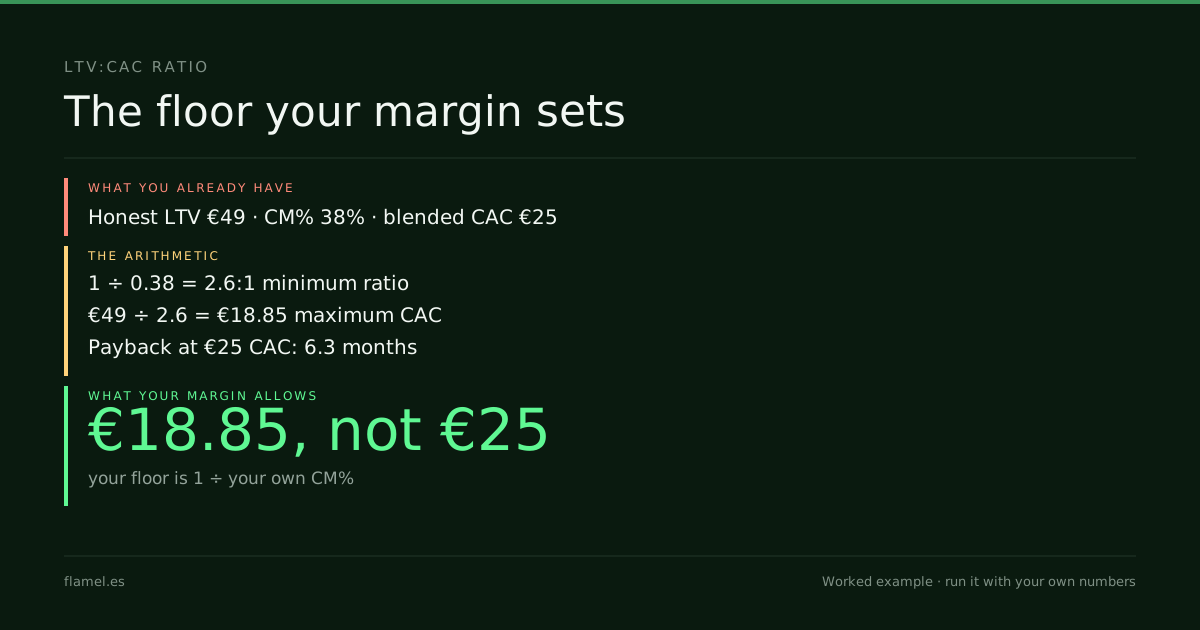
The formula is abstract until you run it on a real store. Gross margin is 45%; with modest variable fulfillment and no paid repeat-purchase program, call CM% at 38%.
Minimum LTV:CAC at 38% CM:
1 ÷ 0.38 = 2.6:1Honest LTV: €49. Maximum sustainable CAC:
€49 ÷ 2.6 = €18.85If your blended CAC is €25 today, you are at a 1.96:1 ratio — below the floor for your margin. Every paid campaign widens the gap.
If instead you moved conversion rate from 1.0% to 1.4% — same sessions, same spend — you add 1,200 customers a year without raising the total acquisition budget. The arithmetic of what that shift is worth runs through the CAC formula: blended CAC drops when the denominator (new customers) rises without the numerator (spend) moving. LTV is unchanged. The ratio improves because you converted more of the traffic you already paid for.
Acquisition is a cost that repeats. A lower blended CAC — achieved by converting more of the traffic you already have — is the one lever that improves both the ratio and the payback period simultaneously. That is what the audit maps: not a channel recommendation, but the exact gap between what your traffic is worth and what your store is capturing from it — measured on a real order we placed and the data in your own Shopify admin.
What to do by Monday. Pull your contribution margin for the last three months: revenue minus COGS minus variable fulfillment minus variable marketing. Divide 1 by that percentage. Write down the result — that is your minimum LTV:CAC floor. Then divide your honest LTV (AOV × repeat orders × CM%) by your blended CAC (total acquisition spend ÷ new customers acquired). If the result is below your floor, the gap in euros is: (floor ratio − your actual ratio) × your blended CAC × new customers this year. That is the cost of the benchmark mismatch, in money, compounding every month you keep spending above the floor.
FAQ
What is a good LTV:CAC ratio for a DTC store?
There is no single good ratio — the floor depends on your contribution margin. Divide 1 by your CM% to get your minimum sustainable LTV:CAC. A store with 38% contribution margin needs at least 2.6:1 to break even on acquisition, not 3:1. Below that floor, every acquisition campaign widens the gap rather than closing it, regardless of what any generic benchmark says.
Why is the 3:1 LTV:CAC target so widely cited?
The 3:1 benchmark originates in SaaS, where customers pay monthly under contract and churn is relatively predictable. Stripe's SaaS unit economics guide describes it as the standard for subscription businesses. DTC stores have no contractual retention — repeat purchase is designed for, or left to luck — so a margin-adjusted minimum is more useful than a number borrowed from a different business model.
How do I calculate CAC payback period for my store?
Payback (months) = CAC ÷ (AOV × contribution margin % × monthly order frequency). For a store with a €25 CAC, €68 AOV, and 1.6 orders per year (0.13 per month) — using 45% gross margin as a proxy for CM% in this example, since the exact variable cost split is not declared — payback is 6.3 months. Any acquisition spend that extends payback beyond your cash reserve window is a cash-flow risk, not a growth investment.
What is the difference between LTV:CAC ratio and CAC payback period?
The LTV:CAC ratio tells you whether unit economics are net positive over a customer's lifetime. The payback period tells you when that turns positive — which is what drives cash flow. A store can show a healthy 3:1 ratio and still face a cash crunch if payback takes nine months and the business is growing fast. Both numbers belong in the same view.
How does improving conversion rate affect my LTV:CAC ratio?
A higher conversion rate adds customers without raising your total acquisition spend. Blended CAC = total acquisition spend ÷ new customers — so more customers from the same budget means a lower blended CAC. LTV stays constant, so the ratio improves. It is the one lever that lowers the CAC denominator without cutting channels or negotiating CPMs.
That gap in euros — the cost of the benchmark mismatch, compounding every month — is exactly what the Conversion Audit maps. Five business days, $500, and the map is yours whether or not you hire us.
Your store, five days.
$500. Zero commitment. Yours either way.