
Customer lifetime value: the formula, and the three inputs everyone gets wrong
LTV inflates itself. Three inputs do it — revenue instead of margin, an undeclared horizon, and a repeat rate measured on the customers who stayed.

Customer lifetime value is the number that decides what you are allowed to pay for a customer. Which is exactly why it is the number most likely to be wrong, and wrong in one direction: up.
Nobody inflates it on purpose. It inflates itself, in three places, and each one is a defensible-looking choice made by someone who was not thinking about the decision the number would end up making.
Key takeaways
- CLV = order value × repeat rate × gross margin over a declared period. Without margin and window, you measure revenue per customer, not actual contribution.
- Measuring repeat rate on surviving customers inflates orders by 50% or more. The cohort that stayed is not the cohort you acquired; most never returned.
- A twelve-month window is the honest default; longer horizons require two years of real data, not extrapolation. An undeclared window makes quarter-over-quarter numbers incomparable.
- Same store, same data: inflated calculation permits 3x higher acquisition spending than corrected one. The difference determines which campaigns actually lose money.
- Recalculate CLV with margin, a declared window, and the full cohort including non-returners. If thin, the problem is retention, not acquisition budget.
The formula, first
Customer lifetime value is what a customer contributes to your business over a stated period.
CLV = average order value × orders per customer × gross margin
Over a window you declare out loud. That last clause is not decoration — it is half the formula, and it is the half that usually goes missing.
Input one — revenue where margin belongs
The most common version of CLV multiplies the order value by the number of orders and stops. That gives you revenue per customer, not value per customer, and the two differ by everything it costs you to fulfil the order.
A customer who spends €68 three times has given you €204 of revenue. If your gross margin is 45%, they have given you €92 of contribution, and the other €112 was already committed to product, shipping and payment fees before you saw a cent of it. Acquisition is paid out of the €92.
The fix is one multiplication and it changes every downstream decision.

Input two — a lifetime nobody declares
"Lifetime" is doing a lot of unsupervised work in that phrase. Some models run it to five years. Some run it to infinity with a discount rate. Most run it to whatever length of history happens to be in the export.
The problem is not that long windows are wrong. It is that an undeclared window makes two numbers uncomparable — yours from last quarter and yours from this one — and lets an optimistic assumption hide inside an arithmetic result.
Declare it, and prefer a horizon you could actually be held to. Twelve months is the honest default for most stores, and twenty-four if you have two years of real data rather than two years of extrapolation. A CLV with no window on it is not a metric. It is a hope with a decimal point.
Input three — a repeat rate measured on the customers who stayed
This is the expensive one, because it looks like rigour.
You want orders per customer, so you look at your repeat purchase data — and if you pull it from the customers who bought again, you have measured the survivors. Everybody who bought once and vanished falls out of the sample, and they are usually the majority.
The cohort that stayed might average 2.4 orders. The cohort you actually acquired averages 1.6, because most of it never came back. The first number describes your best customers. The second describes your business, and it is the one that gets to set your budget.
Fix it the boring way: take every customer acquired in a fixed month, count all their orders in the following twelve, divide by the number of customers you started with — including the ones who never returned.
The three together, on one store
Take the store from the CAC post: €68 average order value.
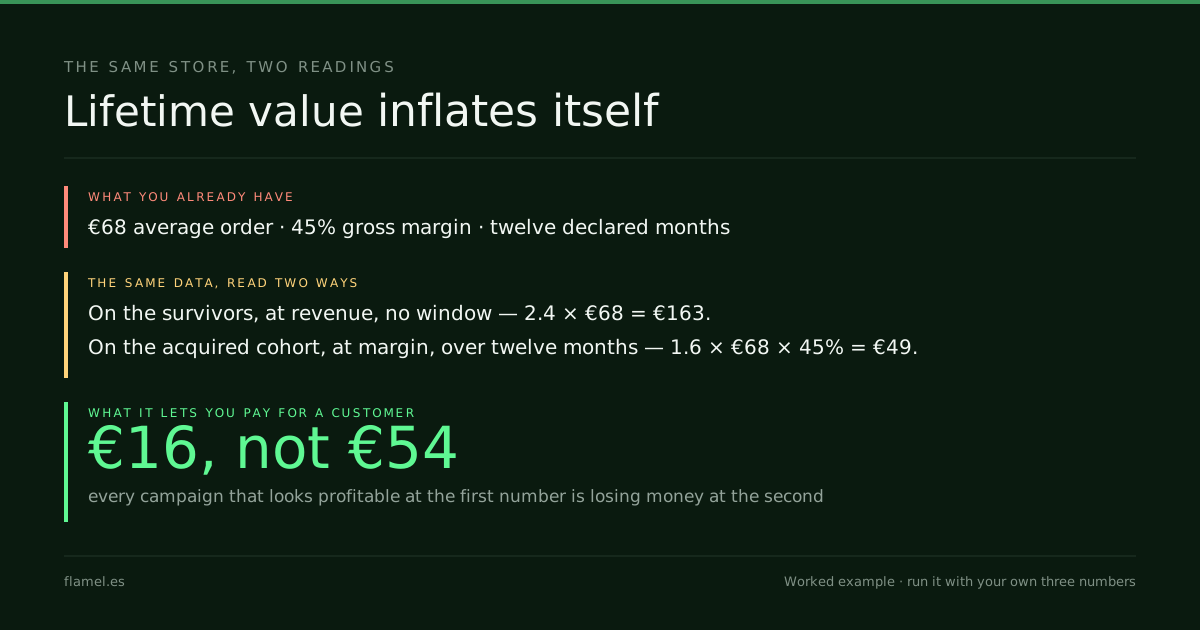
Measured on survivors, at revenue, with no window: 2.4 orders × €68 = €163 of "lifetime value". It is a real calculation. Every input in it is a number from your own analytics.
Measured on the full acquired cohort, at margin, over twelve declared months: 1.6 orders × €68 × 45% = €49.
Same store. Same data. The two numbers differ by a factor of three and a third, and that difference is not academic: at a 3:1 target it is permission to spend €54 to acquire a customer instead of €16. Every campaign that looks profitable at the first number is losing money at the second, and it keeps looking profitable right up until the cash tells you otherwise.
That 3:1 target is itself borrowed from SaaS and it is the wrong number for most stores — its own post, and it's coming.
What to do by Monday
Recalculate it once, out loud, with the three corrections. Margin, not revenue. A window you write down. A cohort that includes the people who never came back.
Then put the result next to your CAC. If the ratio is thinner than you thought, the answer is rarely to spend less on acquisition. It is that the fourth leak — the return trip — is where the value was supposed to come from, and it has not been anybody's job.
If you'd rather have someone else run the three corrections against your own data, that's what the Conversion Audit is. Five business days, $500, and the map is yours whether or not you hire us.
Work through this with your own numbers
You are a DTC store owner calculating your true customer lifetime value. Your average order value is [€ or $], customers who purchased in [month/year] made an average of [X] orders in the following 12 months (measured across ALL customers acquired that month, including those who never returned), and your gross margin is [%]. Calculate CLV = average order value × repeat rate × gross margin. Then tell me: at what customer acquisition cost (CAC) can I afford to spend if I target a 3:1 CLV-to-CAC ratio? What changes about my acquisition strategy if the true ratio is thinner than expected?Your store, five days.
$500. Zero commitment. Yours either way.