
North Star Metric: The Vanity Metric Trap
A north star metric only works if it moves with revenue. Here's the ten-week test that tells you if yours is vanity in disguise.

A north star metric is the single number a company tracks to judge whether the product creates value — not whether it's busy. If yours can climb in a week while revenue drops, you didn't choose a north star metric. You chose a vanity metric with a better name.
Test it before you trust it: pull your last ten weekly north star metric readings and the matching ten weeks of revenue. Count the weeks both moved the same direction. Fewer than seven out of ten, and the metric steering your roadmap is lying to you.
This isn't about picking a north star metric from a blank page. It's a diagnosis for the one you already have — the one you inherited, or picked in year one and never re-checked.
A north star metric is the single metric that captures the core value a product delivers to customers, aligning teams around outcomes, not output. It fails when it rises independently of revenue. A ten-week concordance test settles it: if the metric and revenue moved together in 7 of those 10 weeks (0.7), it tracks value.
Key takeaways
- A north star metric only works if it moves with revenue — not around it, not despite it.
- Most SaaS teams pick an activity metric like WAU or MAU, call it a north star, and never test the correlation.
- A metric survives as north star mostly by tenure, not by evidence — nobody reruns the test after year one.
- The fix isn't a new metric from a list. It's checking the one you have against ten weeks of revenue.
- Pull your last ten weekly north star readings against revenue; below seven concordant weeks, the metric is lying.
What a north star metric actually measures
A north star metric is supposed to be the single number that captures the value a product delivers to customers — not the effort it takes to build it, not the traffic that gets people to sign up. Amplitude's framework defines it that way for a reason: the number should move because customers got something real, not because a campaign pushed people through a funnel.
That definition sounds strict until you check what most SaaS teams actually track. Weekly active users. Monthly logins. Session count. Each answers a question nobody asked — is the product busy? — instead of the one that matters: did the customer get more value this week than last?
The growth literature has a name for the distinction: actionable metrics versus vanity metrics. A vanity metric rises regardless of what happens to the business. A north star metric is supposed to be the opposite — leading, not lagging, and correlated with revenue closely enough to trust between board meetings. Most companies never test that correlation. They pick the number that's easiest to graph, call it a north star metric, and route a year of product decisions through it.
Most guides to north star metrics stop at the list — a dozen SaaS examples, a template to fill in — and never ask whether the example fits your own revenue curve. What follows is the test instead: a way to check the number you already run, before you go looking for a replacement.

When your north star metric wears a vanity metric mask
Here's the failure mode in one sentence: your north star metric can rise in a week where revenue falls, and nobody in the room notices, because nobody built the test that would catch it.
Weekly active users is the most common offender. It rises when you add a free tier, when a re-engagement email pulls in dormant accounts, when a feature update wakes up users who churn a month later without paying a cent. None of that is wrong to track. It's wrong to call it a north star.
The tell is authority, not intent: a metric that's been the north star metric for two years gets treated as correct because it's been the north star metric for two years, not because anyone re-ran the test. That's the same trap a badly inherited customer retention rate baseline sets — a number carried over from last year's deck, never re-derived from this year's cohort.
The ten-week test, run on one product
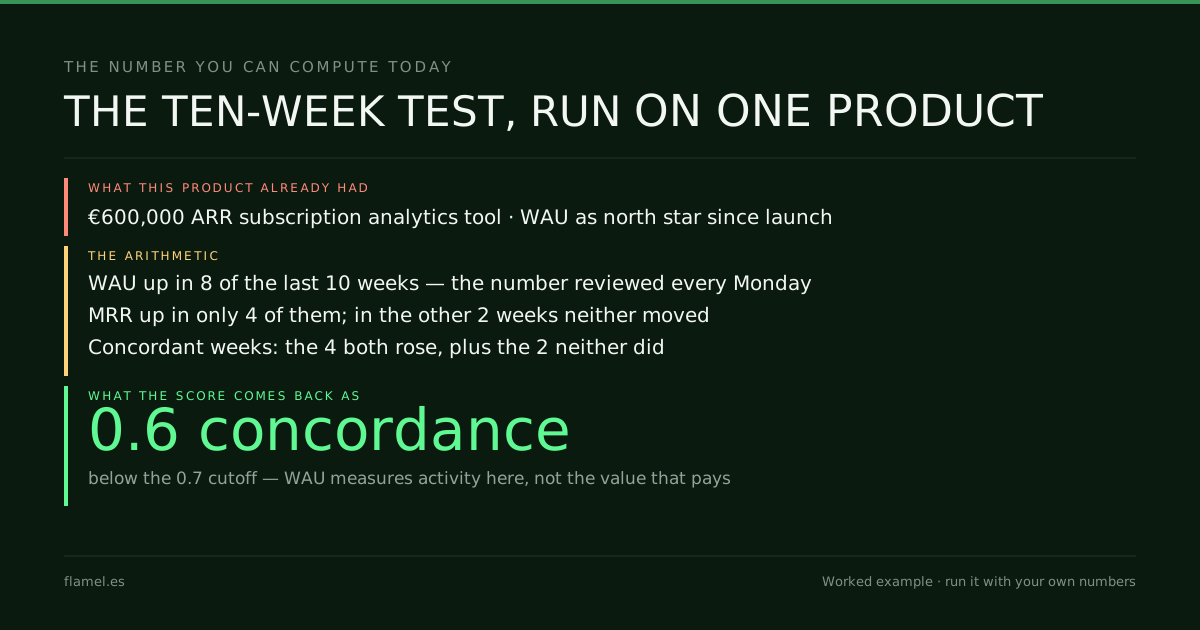
Take a subscription analytics tool at roughly €600,000 ARR — small team, self-serve signup, weekly active users as its north star metric since launch.
Pull the last ten weekly WAU readings: up in 8 of 10 weeks. Pull MRR for the same ten weeks: up in only 4 of them. Four of those eight "good" WAU weeks arrived with flat or falling revenue — logins from a re-engagement campaign that never converted to paid.
The concordance score: 6 out of 10, or 0.6 — the four weeks both rose, plus the two weeks neither did. Below 0.7 — the cutoff this test uses, not an industry standard — for separating a metric that tracks value from one that tracks activity. WAU isn't a bad number. It's the wrong north star metric for this product, at this stage.
North Star Metric Validity Test
1. Pull your last 10 weekly north star metric readings.
2. Pull revenue (MRR or ARR delta) for the same 10 weeks.
3. Count weeks where both moved in the same direction.
4. Score = concordant weeks ÷ 10.
5. Score ≥ 0.7 → the metric tracks value. Keep it.
   Score < 0.7 → it's a vanity metric wearing a north star's name.
A product that fails the test usually has a candidate replacement sitting in its own data: not a new dashboard metric, but a narrower one — accounts that complete a defined value event weekly, rather than accounts that merely open the app. That number moves less often and less dramatically than WAU. It also tends to survive a second ten-week test, which is the only qualification that matters.
This is the same discipline that makes product-led growth work instead of just look like it's working: the metric steering the product has to be checked against revenue on a schedule, not chosen once and trusted forever.
The leading-versus-lagging distinction matters here too. A north star metric should lead revenue by a few weeks — warn you before the P&L does. A metric that only lags revenue, moving in lockstep with it, adds nothing the P&L line doesn't already say. A separate post on the pillar covers how to build that leading window from scratch; it's coming.
What your north star metric is worth getting right
A north star metric chosen badly doesn't just misinform a dashboard. It misallocates a roadmap. Engineers ship features that move WAU because WAU is what gets reviewed on Monday, and every one of those features is a bet against revenue that nobody sized. That's true whether the north star metric in question is WAU, signups, or a proprietary engagement score built by a data team two hires ago; the accounting doesn't care how sophisticated the metric looks on a slide.
A vanity north star metric doesn't just misdirect the roadmap — it hides which of the four places activation actually breaks: signup, first session, time to first value, or week two. WAU rising can mask a signup surge sitting on top of a first-session collapse; the aggregate number goes up while the specific break stays invisible, and the roadmap keeps shipping features for a problem that isn't the real one.
Run the ten-week test today. If the score comes back under 0.7, don't pick a replacement off a list: re-derive the one you have against the revenue it's supposed to predict, and rebuild the roadmap review around whatever passes.
What to do by Monday: Pull your last ten weekly north star metric readings and the matching ten weeks of revenue. Count the concordant weeks. Below seven out of ten, the number steering your product isn't a north star — it's an activity count with a better name, and every roadmap decision built on it needs a second look.
Activation rarely breaks once, loudly. It breaks four times, quietly — at signup, in the first session, in the steps between signup and the thing the user came for, and in week two — and a north star metric built on activity instead of value is exactly the instrument built to miss which one just broke.
Work through this with your own numbers
You are a SaaS operator reviewing whether your north star metric actually tracks value. Your product is at [your current ARR], your north star metric is [name of your north star metric], and you track it weekly. Pull your last ten weekly readings of [your north star metric] and the matching ten weeks of [your revenue or MRR figures]. Count how many of those ten weeks moved in the same direction — both up or both down. Divide that count by ten to get a concordance score. If the score is 0.7 or higher, treat the metric as validated for now. If it is lower, name the likely cause (a free tier, a re-engagement campaign, a dormant-account effect) and decide whether to replace the metric or rebuild how you calculate it. State what you would ship differently next sprint if the score comes back below 0.7.FAQ
What is a north star metric?
A north star metric is the single number a company tracks to judge whether its product is delivering value to customers, distinct from output metrics like features shipped or growth metrics like signups. Amplitude's framework popularized the term: the metric should predict revenue, not just describe activity. A good north star metric moves when customers get real value and stays flat when engagement is superficial — logins without use, signups without activation.
How do I know if my north star metric is actually a vanity metric?
Run a ten-week concordance test: pull your last ten weekly readings of the metric and the matching ten weeks of revenue (MRR or ARR delta). Count the weeks both moved in the same direction. A score of 0.7 or higher (seven of ten weeks) means the metric tracks value. Below that, it's an activity count dressed up as a north star, and roadmap decisions built on it are guesses.
Is weekly active users (WAU) or monthly active users (MAU) a good north star metric?
Only if it clears the concordance test against revenue. WAU and MAU are the most common north star choices because they're easy to graph, but both can rise from free-tier logins, re-engagement emails, or dormant accounts that never pay. Neither is disqualified by definition — only by failing to move with revenue over ten consecutive weeks.
How often should a company re-check its north star metric?
A quarterly re-check is a reasonable default, and any pricing, packaging, or free-tier change is a reason to re-run the test straight away — those are the events most likely to break the correlation between the metric and revenue. A north star metric inherited from a prior team or a prior product stage is the most common source of a stale, disconnected number.
What's the difference between a north star metric and an OKR?
An OKR is a goal with a deadline; a north star metric is a standing gauge with no deadline, meant to be checked weekly for as long as it stays valid. Teams often confuse them by turning a north star into a quarterly target, which pressures teams to move the number itself rather than the value it represents.
That's the same discipline the Activation Audit applies against a product's actual usage data: tracing a vanity metric back to which of the four activation breaks it's hiding, not a workshop slide. The Activation Audit is five business days, $500, and the map is yours whether or not you hire us.
Your store, five days.
$500. Zero commitment. Yours either way.