Product page optimization: four signals that stop a sale
Most product pages lose revenue on four unanswered questions. Here's what each signal costs you per month, with the arithmetic done on your own numbers.

Product page optimization is where most DTC stores leave the most money. Not in the checkout. Not in the email sequence. On the page where the buyer is already looking at the product and a silent question goes unanswered.
Buyers don't write support tickets when they leave. They close the tab. What stops them isn't price — it's uncertainty. Four signals, when missing or broken, create that uncertainty. Each one is invisible until you price the gap.
This post names the four signals, works the arithmetic on a concrete store, and closes with a number you can calculate with your own sessions and average order value.
Product page optimization focuses on four visual and textual trust signals: proof that the product does what it claims, clear shipping terms, friction-free social proof, and a primary image that answers the buyer's first question. Each missing signal represents a measurable revenue gap calculable from your own session and order data.
Key takeaways
- Buyers abandon product pages when four specific signals are missing: product description, trust proof, contextual visuals, and shipping transparency—not because of price, but uncertainty.
- Each missing signal stops a measurable fraction of sessions; a 3% abandonment from poor description on 300k sessions at 1% conversion and €68 AOV costs €6,120 yearly.
- The four gaps compound: a buyer answering one question still faces three more, multiplying revenue loss across the page before checkout is ever reached.
- A 9% combined stop rate across all four gaps represents €1,530/month in lost revenue for a midsize store—enough to justify a formal diagnosis.
- Calculate your own monthly revenue leak: sessions × stop-rate estimate (5–12%) × conversion rate × AOV; if above €2,000/month, fix the priority gap identified by session data.
The four questions buyers never ask
When a buyer lands on a product page, they run a short mental checklist. They don't type it into a chat box. They scan for the answers. If the scan fails, they leave.
The four questions are:
- Does this product do what I need it to do? (description signal)
- Can I trust this store to send it? (trust signal)
- What does it actually look like? (visual signal)
- Will I be stuck if something goes wrong? (guarantee signal)
A page that misses one of these doesn't lose every visitor. It loses a fraction — call it a stop rate — and that fraction, multiplied across your sessions, is a money number.
Signal one: the description gap
Baymard Institute's product page research finds that up to 62% of leading ecommerce sites score "mediocre" or worse on product page UX. The most common failure: information the buyer needs to decide isn't there.
This isn't a copywriting problem. It's a diagnostic problem. The store owner wrote the description knowing the product. The buyer arrives knowing nothing. The gap between what the owner assumed and what the buyer needed is where the session ends.
Take the worked store: 300,000 product page sessions a year, €68 average order, 1.0% store conversion. That's 3,000 orders a year. Every percentage below is a share of the sessions that reach a product page, not of total site traffic. A description that fails to answer the product question for 3% of visitors costs:
Sessions stopped by description gap: 300,000 × 3% = 9,000 visits/year
Revenue gap: 9,000 × 1.0% × €68 = €6,120/year → €510/month
That number assumes the rest of the page is working. It usually isn't.

Signal two: the trust gap
Baymard's product description study documents that users abandon a product when important information is missing — and "important" includes proof that others have bought and not regretted it.
Reviews are the obvious answer, but the format matters as much as the count. A product with 47 four-star reviews and no review text is a different signal than a product with 12 reviews that each describe a specific use case. Volume alone doesn't close the trust gap; specificity does.
The second trust layer is the returns guarantee. A buyer who is uncertain about size, quality, or fit needs to see the return window before adding to cart — not on a policy page three clicks away. Baymard's cart abandonment data puts the average cart abandonment rate at 70.22%. A significant share of that abandonment begins on the product page, before the cart is even reached.
For the worked store, a trust gap that stops 2% of sessions:
Sessions stopped by trust gap: 300,000 × 2% = 6,000 visits/year
Revenue gap: 6,000 × 1.0% × €68 = €4,080/year → €340/month
Signal three: the visual gap
The primary image answers the buyer's first question before any copy does. If the image is a white-background studio shot of a product that gets worn, mounted, or used in a specific context, it answers the wrong question.
A buyer looking at a kitchen accessory wants to see it in a kitchen at scale. A buyer looking at a supplement wants to see the label text, not the packaging glow. The image isn't decoration — it's the first line of description.
This signal is the hardest to audit from a spreadsheet. It requires looking at the page the way a first-time buyer looks at it: with no prior knowledge of the product, on the device they actually use. That's why Redi Foods' rebuild included a full product page system — the result was 4.4% conversion sustained over 22 months on 130,465 measured sessions. The visual system was rebuilt alongside the trust layer, not separately.
For the worked store, a visual gap that stops 1.5% of sessions:
Sessions stopped by visual gap: 300,000 × 1.5% = 4,500 visits/year
Revenue gap: 4,500 × 1.0% × €68 = €3,060/year → €255/month
Signal four: the shipping gap
Shipping cost and delivery time shown late — or not at all — is a conversion killer that appears in the cart data but originates on the product page. The buyer who abandons the cart over a €9 shipping cost didn't leave in the cart. They made that decision on the product page when they couldn't find the number.
The fix isn't free shipping. The fix is visibility. A store that shows estimated delivery and shipping cost on the product page removes the mental calculation the buyer would otherwise do in the cart — and frequently abandon.
For the worked store, a shipping-visibility gap that stops 2.5% of sessions:
Sessions stopped by shipping gap: 300,000 × 2.5% = 7,500 visits/year
Revenue gap: 7,500 × 1.0% × €68 = €5,100/year → €425/month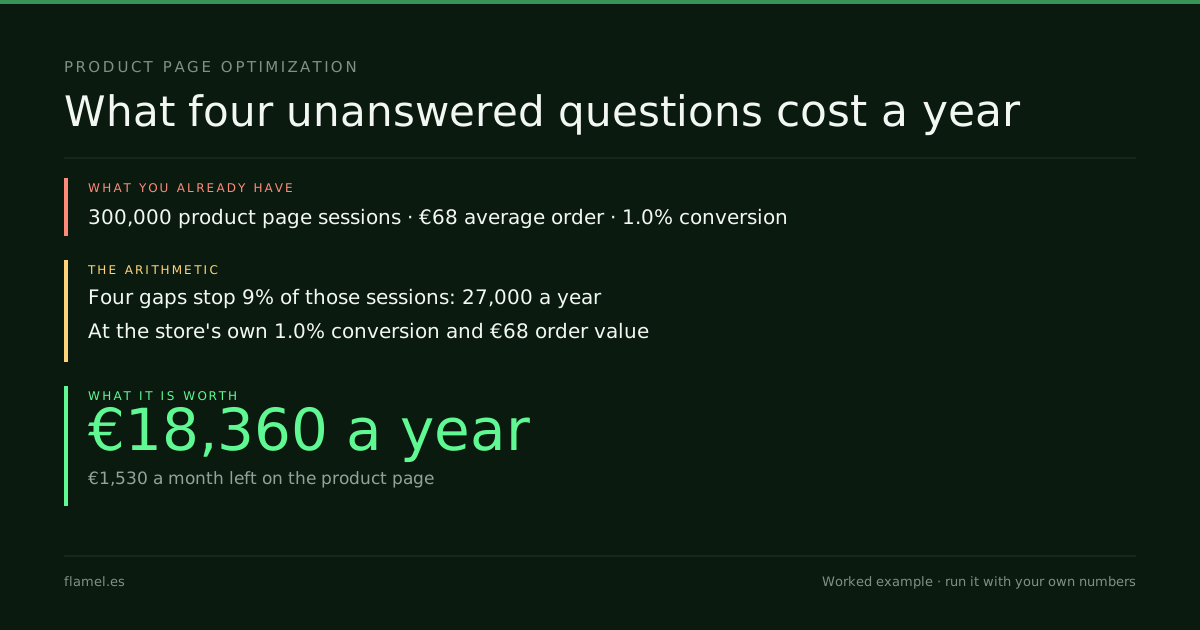
What product page optimization is actually worth
The four gaps don't operate independently. A buyer who gets past the description question still hits the trust question. A buyer who trusts the brand still looks at the image. They compound.
For context on where the product page sits inside the full store — alongside checkout, post-purchase, and repeat order — the ecommerce conversion rate optimization post covers where revenue leaves across each layer. The product page is the first leak, not the only one.
In the worked store, stopping 9% of sessions across four gaps costs:
Total sessions lost: 300,000 × 9% = 27,000 visits/year
Revenue at 1.0% conversion: 27,000 × 1.0% × €68 = €18,360/year
→ €1,530/month left on the product page
What to do by Monday
Calculate your own number. Take your monthly product page sessions, multiply by a conservative stop-rate estimate (start with 5% if you have no data), then multiply by your conversion rate and your average order value:
Product page revenue gap =
  Monthly product page sessions
  × estimated stop rate (0.05–0.12)
  × store conversion rate
  × average order value
If that number is above €500/month, you have a case for a diagnosis. If it's above €2,000/month, the diagnosis has already paid for itself before you act on a single finding. The checkout, the post-purchase experience, and whether a second order is ever designed for — those are their own posts, and they're coming.
Work through this with your own numbers
You are a DTC store owner. Your store receives [monthly product page sessions] monthly sessions, has a [store conversion rate]% conversion rate, and an average order value of [your AOV in euros]. Industry data suggests product pages lose between 5–12% of sessions to missing trust signals. Calculate the monthly revenue gap this represents using the formula: sessions × 0.08 (conservative estimate) × conversion rate × AOV. Based on this number, determine whether a product page audit is justified and which of the four signals (description clarity, trust proof, visual context, shipping visibility) would likely have the biggest impact on your specific store.FAQ
What is product page optimization and why does it affect revenue?
Product page optimization is the process of identifying and fixing the signals that cause buyers to leave without purchasing. Revenue impact comes from the stop rate — the fraction of sessions that hit an unanswered question and exit. For a store with 300,000 product page sessions a year and a €68 average order, a 9% stop rate across four common gaps represents roughly €1,530 lost per month before the buyer ever reaches the cart.
What are the four trust signals that most product pages miss?
The four signals are: a description that answers the buyer's actual question (not the seller's assumed one), social proof with enough specificity to close the trust gap, a primary image that shows the product in its real context of use, and visible shipping cost and delivery time on the product page itself. Each missing signal adds a stop rate that compounds with the others.
How do I calculate how much my product page is costing me per month?
Multiply your monthly product page sessions by an estimated stop rate (5–12% is a reasonable starting range if you have no session-recording data), then multiply by your store's conversion rate and your average order value. The result is the monthly revenue that leaves on the product page before the buyer reaches checkout. A stop rate of 5% on 25,000 monthly product page sessions at 1% conversion and €68 AOV equals €850/month.
Is a low conversion rate always a product page problem?
Not always. The product page is one of four places revenue leaves a DTC store — the others are the checkout, the post-purchase gap, and whether repeat purchase is designed for or left to chance. A low store conversion rate is a symptom; the product page is one possible source. Diagnosing which gap is largest requires looking at where sessions exit, not just at the overall rate.
How long does it take to fix product page trust signals?
The time-to-fix varies: copy changes take days, image reshoots take weeks, return policy visibility is a single layout decision. The harder question is knowing which signal is broken for your specific buyers — and that requires reading your session data and order behavior, not guessing from a checklist. A structured audit identifies the priority fixes so time is spent where the gap is largest.
That's what The Conversion Audit is. Five business days, $500, and the map is yours whether or not you hire us.
Your store, five days.
$500. Zero commitment. Yours either way.

Made between
Barcelona and Bogotá.
What’s holding your store’s sales back, in minutes.
Free, no card. Shopify stores for now.