
Ecommerce conversion rate: the average isn't yours
Ecommerce conversion rate is orders over sessions. Published averages disagree two to one; the number that decides is yours, split by device.

Ecommerce conversion rate is orders divided by sessions, and the published averages for 2026 run from 1.3% to 2.72% depending on who measures. Statista puts worldwide ecommerce visits at 1.3% in the second quarter; Dynamic Yield puts its twelve-month global average at 2.72%.
Same year, two sources, a gap of two to one. Neither number describes your store. Each one blends phones with laptops, cold traffic with repeat buyers, and €18 snacks with €900 sofas.
The benchmark that decides your next move is your own rate, split by device and by traffic source, and priced in euros per tenth of a point. That takes an afternoon and the analytics you already have.
Ecommerce conversion rate is the share of sessions that end in an order: orders ÷ sessions × 100. Published 2026 averages range from 1.3% (Statista, worldwide visits) to 2.72% (Dynamic Yield, twelve months). A good rate is one that beats your own last quarter on each device and traffic source, not an industry average.
Key takeaways
- Ecommerce conversion rate is orders divided by sessions; published 2026 averages run from 1.3% to 2.72%, and the gap comes from who gets measured.
- The same category can land three times apart: food and beverage averages 1.5% in one benchmark and 4.8% in another.
- A blended rate hides two stores. On the example store, 1.0% overall is a 1.7% desktop store and a 0.7% phone store.
- A tenth of a point is worth sessions × 0.001 × average order: €14,280 a year on those phones, €6,120 on desktop.
- Split last quarter's rate by device and traffic source, price a tenth of a point in each, and start where it is worth most.
Why the published averages disagree
Every benchmark answers a narrower question than its headline. Statista counts visits to ecommerce sites worldwide, across every category and country, and reports 1.3% for the second quarter of 2026.
Littledata benchmarked 2,800 Shopify stores in 2023. The average came out at 1.4%, with the best 20% of stores above 3.2% and the best 10% above 4.7%.
Dynamic Yield publishes a rolling figure, 2.72% averaged over the past twelve months as of September 2026. Shopify's 2026 roundup describes that benchmark as data from more than 400 brands.
Different denominators, different samples, different windows. A visit and a session are not always counted the same way. A sample of Shopify stores is not the whole web, and one quarter is not a year. Shopify's roundup lands where the data does: what counts as a good rate depends on context and varies widely by category.
The ecommerce conversion rate by industry
The spread between categories is wider than the spread between sources, and that is the useful part. Two of the benchmarks publish category figures, so they can sit side by side:
| Category | Littledata · 2,800 Shopify stores, 2023 | Dynamic Yield · twelve-month average, September 2026 |
|---|---|---|
| All stores | 1.4% | 2.72% |
| Food & beverage | 1.5% | 4.8% |
| Fashion & apparel | 1.9% | 2.77% |
| Beauty & personal care | — | 5.39% |
| Home & furniture | — | 1.22% |
| Luxury & jewelry | — | 0.72% |
Food and beverage lands three times apart depending on the source. Inside a single source, the categories run from 0.72% to 5.39%, a 7.5× spread.
A store selling €900 sofas and a store selling €18 snacks are not playing the same game. An average across both describes neither. Use the table to place yourself, not to set a target. If your category sits at 1.2% and you convert at 1.1%, the benchmark says you are fine. It says nothing about which half of your traffic is losing the orders.

Your ecommerce conversion rate is two stores
Take the store this blog uses for its arithmetic: 300,000 sessions a year, a €68 average order and 1.0% conversion. That is 3,000 orders and €204,000 in revenue a year.
Now split it. Say 70% of its sessions come from phones and 30% from desktop. That split is an example, not a statistic:
Whole store = 3,000 orders ÷ 300,000 sessions = 1.0%
Phones      = 1,470 orders ÷ 210,000 sessions = 0.7%
Desktop     = 1,530 orders ÷  90,000 sessions = 1.7%
The 1.0% was never one number. It is a 1.7% desktop store sharing a domain with a 0.7% phone store.
Against Littledata's Shopify averages, 1.9% on desktop and 1.2% on mobile, the desktop store sits 0.2 points under. The phone store sits half a point under. The blended figure looked like a problem everywhere. Split, the problem has an address.
The benchmarks do not even agree on direction. Dynamic Yield's twelve-month figures put mobile ahead, 2.88% against 2.37% on desktop. Two sources reach opposite conclusions about the same devices. That is one more reason the only split that describes your customers is your own.
Run the same split by traffic source. Someone meeting the brand for the first time through a paid social ad and a customer clicking through from your email list are not the same visitor. Averaging them hides both.
Wherever the phone store loses its orders, it loses them in one of four places. Two of them are a product page that answers the questions you thought of, not the ones that stop the purchase, and a checkout where the cost shows up late. All four are mapped in where revenue actually leaves a store. Why phones lose more on some stores than on others is its own post, and it's coming.
The comparison that pays off
A store above the average learns nothing from it. A store below it learns only that it is below. The comparison that moves revenue is your store against its own best quarter, segment by segment.
MyDollHair, a Shopify hair-extensions store, multiplied its conversion rate 4.8× in two years, measured on 666,000 sessions. It migrated off WooCommerce and was rebuilt twice: the store in 2024, then the brand and the conversion program in 2025. Its starting point sat below every figure in the table above. The comparison that mattered was with itself two years earlier.
That is also why the Conversion Audit starts by buying: a real order, with a real card, on the device your customers actually use. The phone store gets read from a phone.
One warning before chasing any of these numbers: a rate bought with discounts is a different rate. Cut prices and the conversion rate rises, while margin falls and the customer you attract changes. That is why the arithmetic below holds the average order at €68: a tenth of a point only counts if the order behind it is the same order.
What a tenth of a point is worth
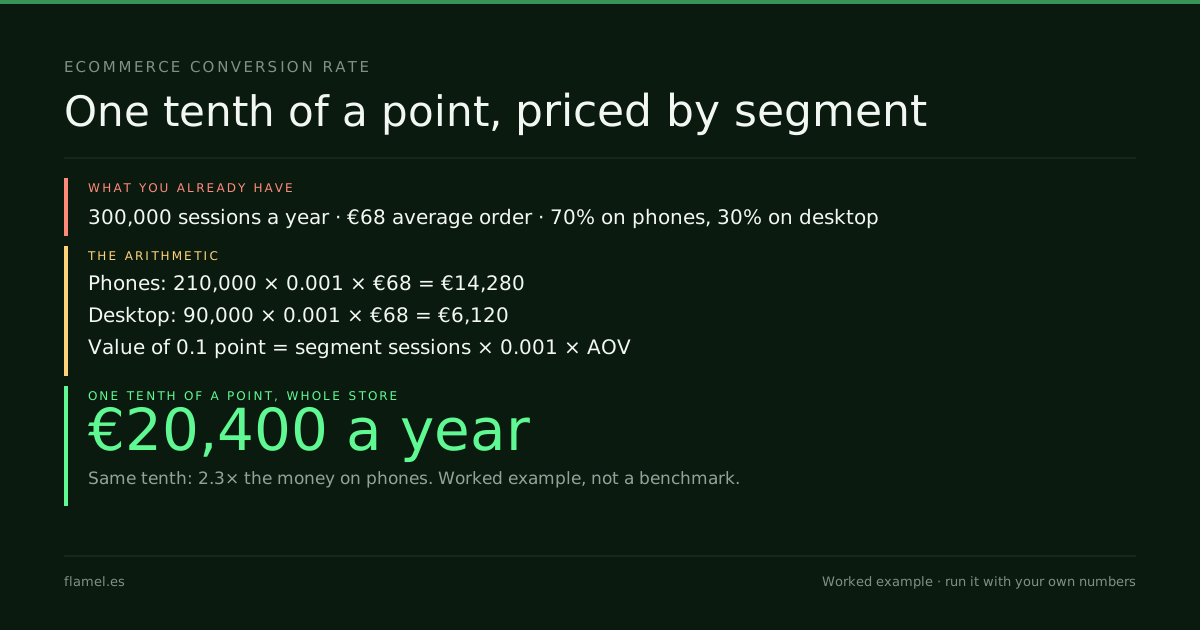
The closing number is the one no benchmark gives you: what 0.1 percentage point is worth in each segment of your store.
Value of 0.1 point = segment sessions × 0.001 × average order value

Whole store:  300,000 × 0.001 × €68 = €20,400 a year
Phones:       210,000 × 0.001 × €68 = €14,280 a year
Desktop:       90,000 × 0.001 × €68 =  €6,120 a year
The same tenth of a point is worth 2.3 times more on phones than on desktop, because that is where the sessions are. These are revenue figures. At the example's 45% gross margin, the whole-store tenth is €9,180 of margin a year: €6,426 from the phones and €2,754 from desktop. Four tenths, the move from 1.0% to 1.4%, is €81,600 of revenue without buying a single extra visit.
What to do by Monday: export last quarter's sessions and orders by device and by traffic source. Compute each segment's rate, then its value per tenth of a point with the formula above. Start with the segment where a tenth is worth most and the rate sits furthest under your own best quarter, not under someone else's average.
Work through this with your own numbers
You are an ecommerce operator reading your own conversion rate instead of an industry average. Using [sessions last quarter by device: mobile, desktop, tablet], [orders last quarter by device], [sessions and orders last quarter by traffic source: paid social, search, email, direct] and [your average order value], calculate the conversion rate of each segment as orders divided by sessions. Then calculate what 0.1 percentage point is worth in each segment over a year: annual segment sessions × 0.001 × average order value. Rank the segments by that value. Compare each segment's rate with [your best quarter's rate for the same segment]. Tell me which segment to work on first and why, and what a half-point lift there would add in revenue and in margin at [your gross margin rate].FAQ
What is a good ecommerce conversion rate?
Published 2026 averages run from 1.3% (Statista, worldwide visits in the second quarter) to 2.72% (Dynamic Yield, twelve-month average), and Littledata puts the best 20% of Shopify stores above 3.2%. Those figures mix categories, devices and traffic sources, so none of them is a target. A good rate is one that beats your own previous quarter on each device and traffic source, priced in revenue per tenth of a point.
How do you calculate ecommerce conversion rate?
Divide orders by sessions over the same window and multiply by 100. A store with 3,000 orders from 300,000 sessions in a year converts at 1.0%. Calculate it by device and by traffic source as well as for the whole store, because the blended figure averages segments that behave very differently and hides where the orders are lost.
What is the average ecommerce conversion rate by industry?
It depends on the benchmark. Dynamic Yield's twelve-month averages run from 0.72% in luxury and jewelry to 5.39% in beauty and personal care, with food and beverage at 4.8%. Littledata's 2023 study of 2,800 Shopify stores puts food and beverage at 1.5% and fashion at 1.9%. The same category can sit three times apart depending on who gets measured.
Does mobile convert worse than desktop?
In Littledata's Shopify data, yes: 1.2% on mobile against 1.9% on desktop. Dynamic Yield's twelve-month figures show the opposite, 2.88% on mobile against 2.37% on desktop. The benchmarks disagree on the direction, which is why your own split matters more. On a store where phones bring 70% of sessions, a tenth of a point there is worth 2.3 times a tenth on desktop.
How much is a 0.1 point increase in conversion rate worth?
Multiply the segment's annual sessions by 0.001 and by your average order value. On a store with 300,000 sessions a year and a €68 average order, a tenth of a point is worth €20,400 in revenue a year, or €9,180 in margin at a 45% gross margin. Run it per device and per traffic source to see where the tenth is worth most.
That's what the Conversion Audit maps: five business days, $500, and the map is yours whether or not you hire us.
Your store, five days.
$500. Zero commitment. Yours either way.