
User Onboarding Best Practices: Price the First Session
User onboarding best practices need a revenue test. Calculate what one activation point adds to MRR before paying for a first-session redesign.

User onboarding best practices are ways to help new users reach a useful result: a focused welcome, a relevant checklist, a guided first task. Their business value depends on how many additional users activate, how many then pay, and what those customers contribute. An activated user is not yet a paying customer, and annual contract value is not monthly cash.
For a founder deciding what to fund next, that distinction changes the answer. A first-session rebuild can improve activation and still fail to recover its cost within the quarter. The useful question is how much additional paid revenue the improvement supports, under assumptions you can inspect.
User onboarding best practices help users reach a useful first result. To price an improvement, multiply monthly signups by the activation-rate lift, activated-to-paid conversion, and monthly revenue per customer. The result is additional MRR per signup cohort. Include payment timing, retention, and margin before comparing that revenue with the cost of a redesign.
Key takeaways
- An activated user is not yet a paying customer. Estimate paid conversion separately before valuing a first-session improvement.
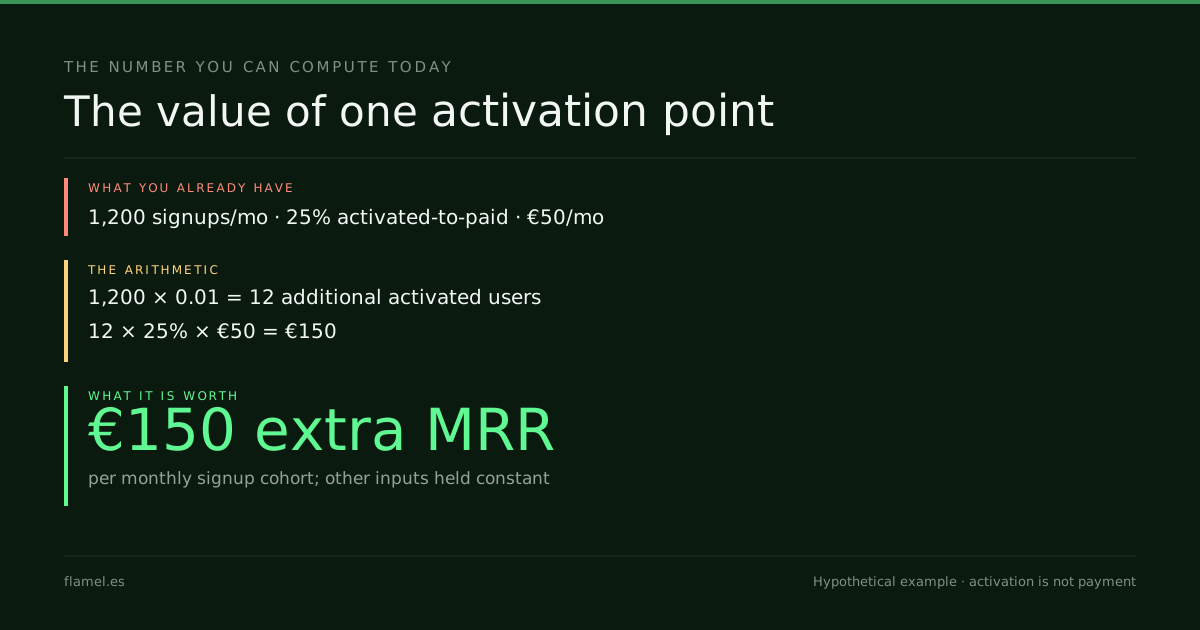
- In the hypothetical example, one activation point adds €150 MRR per monthly signup cohort.
- Three activation points contribute €2,160 toward build cost over the illustrative quarter, assuming 80% gross margin and favorable payment timing.
- Annual contract value is not monthly cash. Include collection timing, retention, and margin when estimating payback.
- Price the next onboarding change using your signup volume, activation lift, paid conversion, monthly customer revenue, and build cost.
User onboarding best practices start with one useful result
A welcome screen, checklist, or product tour is a delivery choice. The result it should help a user reach is more specific: saving a usable project, importing meaningful data, or completing a first transaction. Choose the event that represents value in your product, then distinguish it from simply finishing the interface.
For the first-session question, count users who reach that event before their first visit ends. Keep a separate seven-day measure if your product needs longer to show value. Changing the measurement window while comparing designs can make activation appear to improve even when the experience has not changed.
This is also why choosing a north star metric matters before pricing a redesign. A completed checklist can be an easy event to increase. If it has no measured relationship with a customer paying and staying, its increase gives you little basis for an investment decision.
There is no universal order in which to buy the familiar tactics. A checklist deserves funding when it addresses a measured obstacle to that first result. A tour deserves the same scrutiny. Removing a welcome screen may be a better candidate than adding one if the screen delays a task users already understand. These are hypotheses to test, not promised conversion gains. Flamel reads the product's own analytics and recordings across signup, first session, time to first value, and retention. That separates a first-session obstacle from a payment or week-two problem before a founder funds the wrong fix.
A benchmark cannot supply your conversion rate
In its 2022 discussion with OpenView, Amplitude reports activation of 20–30% at standout product-led companies and explains that the activation event differs by product. Treat that as historical context. It is neither a current universal target nor evidence that your first-session event uses the same definition or time window.
Your investment case needs an additional number: the share of activated users who become paying customers within a stated period. Measure both stages for comparable signup cohorts. If activated users convert better, that association can help estimate a scenario; it does not prove a redesign will cause the same improvement. Acquisition source, customer fit, pricing, and seasonality can change the relationship.
An experiment or a carefully controlled comparison should test that assumption. Watch paid conversion and subsequent retention alongside activation. Faster setup that attracts more low-fit users could raise activation while weakening the revenue result. The owner needs to see that possibility before signing off on the build.

A worked example: activation is not payment
Consider a hypothetical SaaS business at €900,000 ARR, equivalent to €75,000 MRR. It has 1,500 paying customers at an average €50 per month. All figures below are illustrative assumptions, not a client result or a benchmark.
Each month, 1,200 new trial users sign up. Assume 24% reach the first-session value event, and 25% of those activated users become paying customers. That gives 288 activated users and 72 new customers from that path: €3,600 of new MRR per monthly signup cohort, before churn or expansion. Existing customers explain the larger installed revenue base; new signups are not the entire business.
A proposed €60,000 redesign is modeled at 27% activation. That three-percentage-point lift is a scenario to test, not an expected outcome. Keep signup volume, activated-to-paid conversion, price, and retention unchanged for this comparison.
The difference is 36 additional activated users per cohort. At 25% conversion to paid, they yield nine expected additional customers. Nine times €50 adds €450 MRR from that cohort. It does not add €21,600 of monthly revenue, and the 36 activated users are not 36 paying customers.
The same arithmetic values one percentage point: 1,200 × 0.01 × 0.25 × €50 = €150 of additional MRR per monthly signup cohort. Expected customer counts can be fractional in a planning model; actual customer counts will vary. At a 10% activated-to-paid rate, that one point would be worth €60 instead.
What the first quarter actually returns
MRR describes a recurring revenue rate. Recovering a build cost depends on revenue collected over time and the cost of serving those customers. Do not divide a one-time investment by annual contract value and label the answer months.
For a transparent illustration, assume every additional customer starts paying at the beginning of their signup month, pays monthly, and stays through the quarter. This deliberately favorable timing means the first cohort contributes for three months, the second for two, and the third for one. A real trial-to-paid delay would reduce the quarter's receipts.
At three additional activation points, incremental revenue over those six cohort-months is €450 × (3 + 2 + 1) = €2,700. With an assumed 80% gross margin, that contributes €2,160 toward the build cost, before any extra operating expense. A €60,000 rebuild therefore does not pay for itself in that quarter under these assumptions.
| Scenario | Extra MRR per signup cohort | Quarter revenue | Contribution at 80% margin | |---|---:|---:|---:| | +1 activation point | €150 | €900 | €720 | | +3 activation points | €450 | €2,700 | €2,160 | | +5 activation points | €750 | €4,500 | €3,600 |
The table holds payment timing and retention constant. It is a sensitivity check, not a forecast. For a longer decision horizon, use actual cohort survival and collection schedules. Retention changes the value of the customer base; assuming every cohort stays forever can make an expensive project look deceptively cheap.
A spending decision with visible assumptions
A €2,160 quarter contribution does not automatically rule out every onboarding investment. It sets the scale of the case. A smaller experiment, a lower build cost, a longer approved payback period, or separately measured benefits could change the decision. Each belongs in the model with its own evidence.
Do not count the same new customer again under a separate product-led growth initiative. If acquisition and onboarding change together, isolate their effects or disclose that attribution remains uncertain. Otherwise two teams can claim the revenue from one customer and both projects appear to pay back.
For your own decision, replace the example's signup count, activation lift, activated-to-paid rate, and monthly revenue per customer. Keep rates as decimals: one percentage point is 0.01. Multiply those four inputs to estimate additional MRR per signup cohort, then model collection timing, retention, and margin before comparing the result with cost. In this example, one first-session activation point is worth €150 in additional MRR per monthly signup cohort.
Work through this with your own numbers
You are a SaaS operator evaluating an onboarding investment. Use my [monthly signups], [current first-session activation rate], [proposed lift in percentage points], [activated-to-paid conversion rate and observation window], [monthly revenue per paying customer], [gross margin], [build cost], [payment delay], and [cohort retention]. Calculate additional activated users, expected additional paying customers, and MRR per signup cohort. Then calculate incremental revenue collected and contribution over [decision horizon], showing each cohort separately. Compare contribution with build cost and identify any remaining gap. Do not equate activation with payment or annual contract value with monthly cash. Ask for missing inputs instead of inventing them. Label assumptions, test lower paid conversion and delayed payment, and state that modeled lift is not proven causal impact.FAQ
What are user onboarding best practices for a SaaS product?
They include a focused welcome, relevant checklists, and guidance toward the first useful task. Their value depends on your product and the obstacle each removes. Define the activation event and its measurement window, then test whether a change improves paid conversion and retention as well. Finishing a product tour is not sufficient evidence that a customer has received value or will pay.
How much is one activation point worth?
Multiply monthly signups by 0.01, the activated-to-paid conversion rate, and monthly revenue per paying customer. In the hypothetical example, 1,200 × 0.01 × 25% × €50 gives €150 additional MRR per monthly signup cohort. This holds the other inputs constant. It estimates a recurring revenue rate, not profit, cash received immediately, or a guaranteed improvement from a redesign.
Does more activation guarantee more revenue?
No. Activation is a product behavior, while payment is a separate outcome. A redesign could increase checklist completion without changing willingness to pay. It could also change the mix of users who activate. Check paid conversion and retention for comparable cohorts, and use an experiment where practical. An observed association between activation and payment does not by itself establish the revenue caused by a proposed change.
How should a founder calculate onboarding payback?
Compare the investment with incremental contribution over a stated period. Include when each cohort starts paying, how long it stays, gross margin, and any additional operating costs. In the example's favorable quarter scenario, €2,700 additional revenue becomes €2,160 contribution at 80% margin. That does not recover a €60,000 build. Annual contract value alone cannot establish the number of months needed for cash payback.
See the Activation Audit — five business days, $500, and the map is yours whether or not you hire us.
Your store, five days.
$500. Zero commitment. Yours either way.