
AOV meaning, formula and what it tells your store
AOV meaning: total revenue divided by orders in a period. The formula, a worked example, and what €5 more per order is worth annually.

AOV meaning comes up fast when you start reading about ecommerce metrics — then disappears into a vague instruction to 'increase it.' That's the wrong starting point. AOV tells you how much each order is worth on average, and whether the revenue you're generating is worth the margin you spend to generate it.
A store can have strong traffic, a healthy conversion rate, and still be growing broke — because every order is too small to cover acquisition cost. AOV is where you find out.
AOV — average order value — is total revenue divided by number of orders in a given period. If a store earns €204,000 from 3,000 orders in a year, its AOV is €68. It measures how much each transaction is worth, and it's one of the four numbers that determine whether a store grows profitably.
Key takeaways
- AOV is total revenue divided by orders in the same window. The window changes the number more than the definition does, so always state the period.
- AOV means little without margin: at €68 and 45% gross margin, each order leaves €30.60, and that is the figure acquisition cost has to beat.
- Four levers move AOV, and only one of them is raising prices. The other three are a free shipping threshold, bundles and upsells.
- On a store with 3,000 orders a year, €5 more per order is €15,000 in revenue and €6,750 in gross profit, with no extra traffic.
- Multiply your own annual order count by €5 and by your gross margin: that is what one small addition to the average basket is worth to you.
AOV meaning — the one-line definition
AOV stands for average order value. It is the mean revenue generated per transaction in a defined time window.
The definition matters less than the window. An AOV calculated over a holiday month is a different number from the same store’s annual figure — and decisions made from the wrong window cost money. Always state the period alongside the figure.
Shopify defines AOV as total revenue divided by total orders in the same period. Revenue and orders from two different date ranges produce a number that means nothing.
The average order value formula — three numbers, one line
The formula:
AOV = Total Revenue ÷ Number of OrdersTake the blog’s worked store: 300,000 sessions a year, 1.0 % conversion rate, €68 average order.
- Orders per year: 300,000 × 1.0 % = 3,000
- Annual revenue: 3,000 × €68 = €204,000
- AOV: €204,000 ÷ 3,000 = €68
Run it for your own store. Pull total revenue and total orders from the same trailing 30 days. Divide.
One caution: if your store processes refunds at a material rate, use net revenue in the numerator. A gross AOV inflated by returns will misprize every decision downstream.

What average order value signals — and what it hides
AOV is a signal, not a verdict. A high AOV on low margin is worse than a moderate AOV on solid margin — the metric says nothing about what it cost you to generate each order.
The number that matters alongside AOV is gross margin per order. For the worked store at 45 % gross margin and €68 AOV, each order contributes €30.60 before fulfillment and acquisition cost. That’s the number CAC has to beat — and how customer acquisition cost and AOV set the ceiling on profitable growth.
AOV also interacts with LTV. A store where customers place 1.6 orders over twelve months has an honest LTV of €68 × 1.6 × 45 % = €48.96 — measured on the full acquired cohort, at margin, over twelve declared months. If CAC is above that, the store acquires customers at a loss. The full LTV calculation is already its own post.
The four levers that move AOV
Four mechanisms push average order value up without requiring one more visitor — and only one of them is raising prices:
- Price — the lever everyone reaches for first, and the only one that charges more for the same basket. It moves AOV in one line of the admin, and usually pushes the conversion rate the other way.
- Free shipping threshold — set above current AOV so customers add one more item to qualify. On the worked store, with a €6 blended shipping cost, it lands at €82: the free shipping threshold, set with your own numbers. Effective only when visible at the right moment on the cart page.
- Bundles — fixed sets priced at a discount that still clears the margin of individual items. Run the discount against your actual gross margin before the bundle goes live.
- Upsells — a higher-tier variant or a complementary item surfaced before ‘add to cart’, or offered after the order is placed and charged to the card already on file. After checkout the purchase decision has already been made, so the friction is lower than anywhere else in the funnel.
None of these levers works in isolation. Each sits inside a store that leaks in four places — the product page, the checkout, the gap after purchase, and a second order left to chance — and the conversion rate post maps all four. Knowing which lever is underperforming takes reading the data, not guessing from outside.
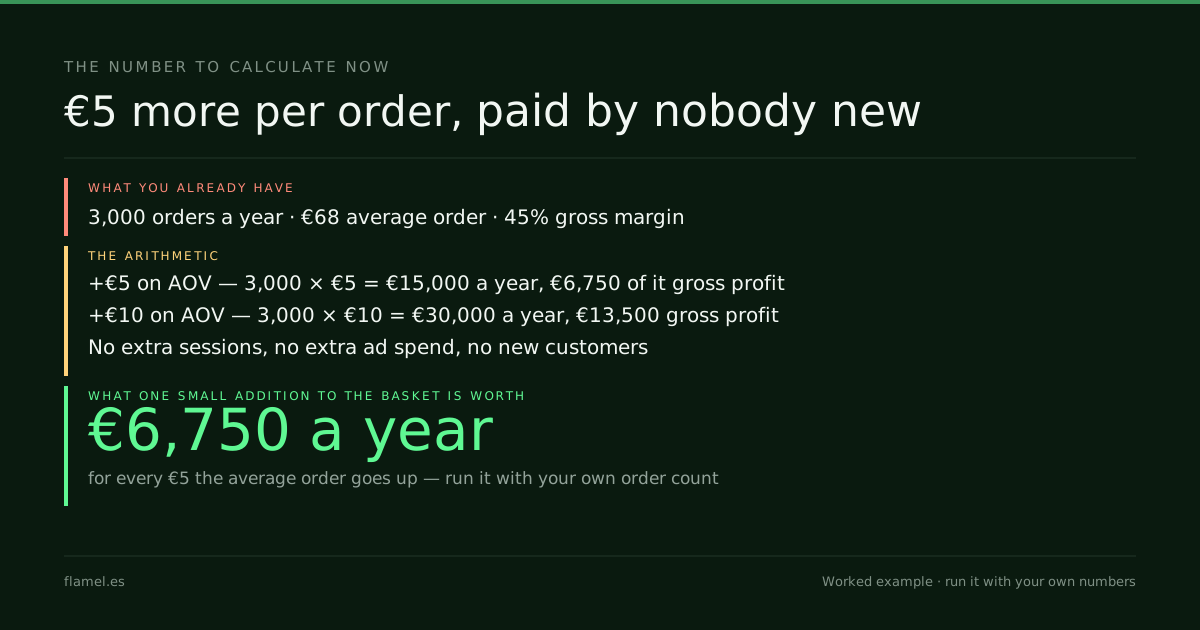
What €5 more on AOV is worth — the number to calculate now
Back to the worked store: 3,000 orders a year at €68 AOV.
If AOV rises by €5:
- Additional revenue: 3,000 × €5 = €15,000 a year
- At 45 % gross margin: €6,750 in additional gross profit
If AOV rises by €10:
- Additional revenue: 3,000 × €10 = €30,000 a year
- Additional gross profit: €13,500
No extra sessions. No extra ad spend. No new customers.
Now run it for your store. Take your order count over the last 12 months, multiply by €5, multiply by your gross margin. That is what a single small product added to the average basket is worth annually.
What to do by Monday: Pull your AOV for the last 30 days and the last 12 months from your Shopify admin (Analytics → Overview → Average order value). If the 30-day number is meaningfully below the annual figure, your most recent cohort is spending less, and that gap has a cause worth finding.
Work through this with your own numbers
You are an ecommerce finance analyst. My store's numbers for the last 12 months: revenue [annual revenue], orders [annual order count], gross margin [gross margin %], average shipping cost per order [shipping cost per order]. For the last 30 days: revenue [30-day revenue], orders [30-day orders].

1. Calculate my AOV for both periods as revenue divided by orders. Tell me whether the 30-day figure sits meaningfully below the annual one, and what that would suggest about my most recent customers.
2. Calculate my gross margin per order at the annual AOV.
3. Calculate what €5 and €10 more per order would add each year, in revenue and in gross profit, using my annual order count.
4. Four levers move AOV: price, a free shipping threshold, bundles and upsells. Given my margin and shipping cost, tell me which of the three non-price levers to test first, and what result would make raising prices the better choice.
FAQ
What does AOV mean in ecommerce?
AOV stands for average order value. It is the mean revenue generated per transaction in a defined time period, calculated by dividing total revenue by the number of orders in the same period. It tells you how much each transaction is worth on average and is one of four numbers — alongside traffic, conversion rate, and repeat purchase — that determine whether a store grows profitably.
How do I calculate my AOV?
Divide your total revenue by your total number of orders for the same time window. For example, if your store generated €204,000 from 3,000 orders in a year, your AOV is €68. Always use the same date range for both figures. If refunds are material, use net revenue after refunds in the numerator to avoid an inflated number that misprices downstream decisions.
What is a good AOV for an ecommerce store?
There is no universal benchmark. AOV is only meaningful relative to your gross margin and customer acquisition cost. A €120 AOV on a 20 % margin may be worse than a €60 AOV on a 50 % margin, because gross profit per order is what has to exceed CAC. Compare your AOV against your own margin and CAC before referencing any industry figure.
How does AOV relate to LTV?
LTV is AOV multiplied by the number of orders a customer places over a defined period, adjusted for margin. A store with a €68 AOV, 45 % gross margin, and 1.6 orders per acquired customer over twelve months has an honest LTV of roughly €49. Raising AOV by €5 lifts LTV by €5 × 1.6 × 45 % = €3.60 per customer, without acquiring one more.
What is the fastest way to increase AOV without more traffic?
Four mechanisms move AOV without additional traffic, and only one is raising prices. The other three are a free shipping threshold set above current AOV, bundles priced at a margin-positive discount, and upsells before or after checkout. Each requires the discount or threshold to be calculated against your actual gross margin before it goes live.
That’s what the Conversion Audit maps. We read your Shopify admin with your access, place a real order, and show you exactly where the revenue leaves — and what fixing it is worth. Five business days, $500, and the map is yours whether or not you hire us.
Your store, five days.
$500. Zero commitment. Yours either way.