
Cart abandonment rate formula: not your benchmark
The cart abandonment rate formula is one line. Published averages run from 70.22% to 77.55%. The rate that decides is yours, read at both gates.

The cart abandonment rate formula is one line: carts that did not become orders, divided by carts created, times 100. A store with 12,000 carts and 3,000 orders abandons 75% of them. The sum takes a minute. Deciding what it is worth takes the rest of this post.
Then comes the benchmark, and the benchmarks disagree. Baymard Institute puts the average documented rate at 70.22%, pooled from 50 studies published between 2006 and 2025. Dynamic Yield puts its global figure at 77.55% over the past twelve months. Seven points apart, and neither number describes a single store.
The gap is not sloppiness. The two figures count different events, over different windows, at different gates. Which is exactly why reading your own rate against either of them tells you so little.
Cart abandonment rate = (1 − orders ÷ carts created) × 100. A store with 12,000 carts and 3,000 orders abandons 75%. Published averages disagree: Baymard documents 70.22% across 50 studies, Dynamic Yield reports 77.55% over twelve months. The rate that decides is your own, read at the cart gate and the checkout gate separately.
Key takeaways
- Cart abandonment rate is one minus orders over carts created. With 12,000 carts and 3,000 orders, a store abandons 75% of them.
- The published averages disagree by seven points: Baymard documents 70.22% across 50 studies, Dynamic Yield reports 77.55% over twelve months.
- Cart and checkout are two gates with two denominators. On the example store they lose 60% and 37.5%, and the blended 75% names neither.
- Baymard reports 42% of shoppers abandon because they were only browsing, so roughly 31 of the example store's 75 points were never recoverable.
- One recovered point is carts created × 0.01 × average order: 120 orders and €8,160 a year on the example store.
The cart abandonment rate formula, and its denominator
Cart abandonment rate = (1 − orders ÷ carts created) × 100Take the store this blog uses for its arithmetic: 300,000 sessions a year, a €68 average order and a 1.0% conversion rate. That is 3,000 orders. Say 12,000 of those sessions put something in a cart — a 4% add-to-cart rate, declared here as part of the example, not borrowed from anyone's benchmark.
Carts created   12,000
Orders           3,000
Abandonment      1 − 3,000 ÷ 12,000 = 75%
Every term in that sum is a choice. A cart created on Monday by a returning customer who buys on Thursday counts as abandoned if the window is a day, and converted if the window is a week. A cart created by a bot counts as abandoned forever. Change the window, change the number. Before comparing anything with anyone, write down your own window and keep it.
Why the published averages disagree
Baymard maintains the most-cited figure: 70.22%, an average of 50 separate studies published between 2006 and 2025. It is a meta-average — stable because it spans two decades, and blunt for the same reason.
Dynamic Yield measures its own network over a rolling twelve months and reports 77.55% globally. It also publishes the splits the headline hides: 79.84% on mobile against 69.48% on desktop, and a regional spread from 74.5% in the Americas to 81.53% in APAC.
Seven points between the two headlines. Ten points between phones and desktops inside one of them. The device gap alone is wider than the distance most stores believe separates them from average.
So a store sitting at 75% reads five points worse than the world against one source, and five points better against the other source's mobile figure. Nothing about the store changed. Only the yardstick did.

Cart and checkout are two different gates
The deeper confusion is not which source to trust. It is that abandonment names two different events, and the market uses one word for both.
A shopper who adds an item and drifts back to the category page has abandoned a cart. A shopper who enters checkout, types an address, sees a shipping cost appear and leaves has abandoned a checkout. The first is a cousin of browsing. The second is an order that was already half made.
Cart gate      = 1 − checkouts started ÷ carts created
Checkout gate  = 1 − orders ÷ checkouts started
Most analytics hand you neither denominator by default. Carts created and checkouts started are events somebody had to tag; if nobody did, the rate being quoted in the meeting is sessions-based and is not this number at all. Check which one the dashboard is actually counting before defending it.
Run both on the example store. With 12,000 carts, 4,800 checkouts started and 3,000 orders, the cart gate loses 60% and the checkout gate loses 37.5%. The blended 75% is neither of those numbers, and it points at neither problem.
That split decides where the work goes. A store bleeding at the cart gate has a price, delivery or product-page problem. A store bleeding at the checkout gate has a checkout problem — fields, fees and missing payment methods — which is the cheapest of the four to fix.
What the cart abandonment rate formula leaves out
Not all of it was ever available, and pretending otherwise is how a store burns a quarter.
Baymard's reason data separates the two kinds. Among online shoppers in the United States, 42% abandoned simply because they were browsing and not ready to buy: that share is the cost of having a cart at all, not a design failure. Of the rest, the reasons are concrete and ranked. 40% left because extra costs — shipping, tax, fees — were too high, 20% because delivery was too slow, 19% because they would not trust the site with card details, 18% because an account was required, and 17% because checkout ran too long.
Four of those five are decisions somebody made on purpose. Showing the full cost late is a choice about sequence. Requiring an account is a choice. Where the free shipping threshold sits is a choice with a sum behind it.
Apply Baymard's browsing share to the example store and roughly 31 of its 75 points are not a design problem at all. The 44 that remain are. That subtraction is the difference between a target worth chasing and a target that was never reachable.
What one recovered point is worth
The closing number is the one no benchmark will give you.
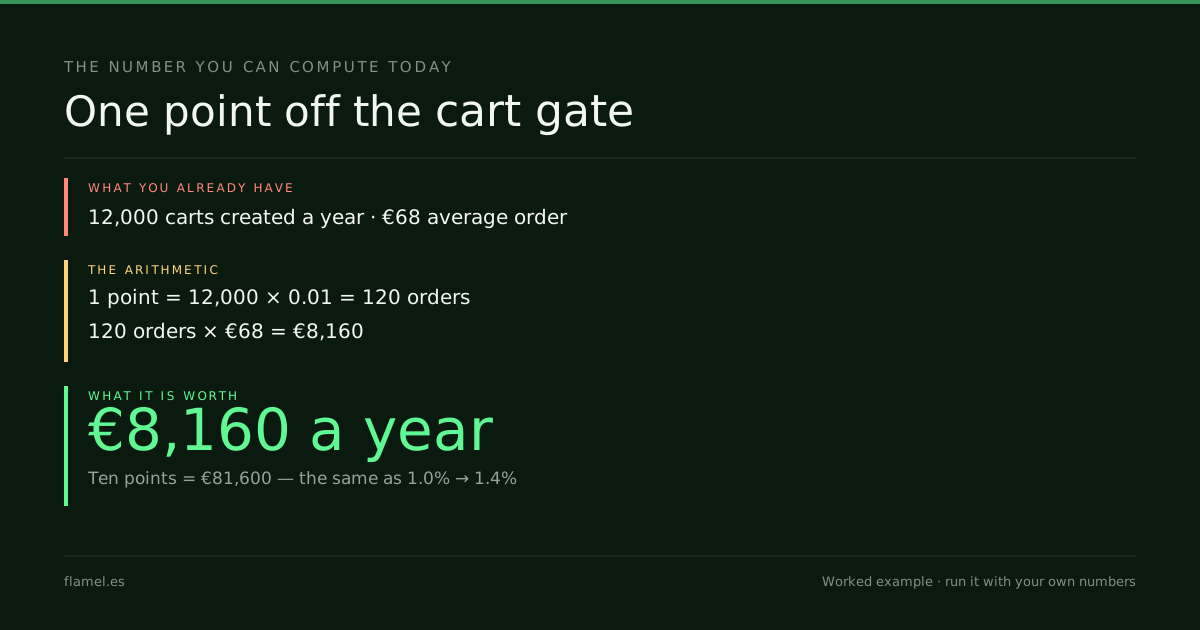
Value of 1 point = carts created × 0.01 × average order value

Example store: 12,000 × 0.01 × €68 = €8,160 a year
One point off the rate is 120 more orders. Ten points is 1,200 orders and €81,600 a year — the same gain as moving that store from a 1.0% to a 1.4% conversion rate, and reachable without buying one extra visit. What a good conversion rate looks like is the other half of the same arithmetic, and where revenue actually leaves a store maps all four of the places it goes.
At the example's 45% gross margin, that point is worth €3,672 in margin rather than €8,160 in revenue. Both numbers matter, and only one of them pays salaries.
A store that reads its own gates this way stops arguing about the benchmark. MyDollHair, a Shopify hair-extensions store, multiplied its conversion rate 4.8× in two years, measured across 666,000 sessions. It got there by reading its own numbers against its own past, never against a published average.
What to do by Monday: pull last quarter's carts created, checkouts started and orders out of the analytics already running. Compute both gates. Multiply carts created by 0.01 and by the average order to price a single point. Then start at the gate that is both worse than last quarter and worth more per point — and leave the world average where you found it.
Work through this with your own numbers
You are an ecommerce operator reading your own cart abandonment instead of an industry average. Using [carts created last quarter], [checkouts started last quarter], [orders last quarter] and [your average order value], calculate three numbers: the cart gate as one minus checkouts started over carts created, the checkout gate as one minus orders over checkouts started, and the blended rate as one minus orders over carts created. Then price one point at each gate: annual volume at that gate multiplied by 0.01 and by the average order value. Compare all three against [the same three numbers from your best quarter]. Tell me which gate to work on first, what a five-point improvement there would add in revenue and in margin at [your gross margin rate], and which abandonment reason to check first given [what your checkout asks for before it shows the shipping cost].FAQ
What is the cart abandonment rate formula?
Cart abandonment rate = (1 − orders ÷ carts created) × 100, measured over one declared window. A store with 12,000 carts and 3,000 orders in a year abandons 75% of them. The window is part of the formula: a cart created on Monday and bought on Thursday is abandoned under a one-day window and converted under a one-week window, so write the window down before comparing the result with anything.
What is a good cart abandonment rate?
There is no single good number, because the published averages disagree by seven points. Baymard pools 50 studies from 2006 to 2025 and documents 70.22%; Dynamic Yield reports 77.55% across its own network over twelve months, rising to 79.84% on mobile and falling to 69.48% on desktop. A good rate is one below your own last quarter at each gate, on the same device mix.
What is the difference between cart abandonment and checkout abandonment?
They are two gates with two denominators. Cart abandonment is one minus checkouts started over carts created; checkout abandonment is one minus orders over checkouts started. On a store with 12,000 carts, 4,800 checkouts started and 3,000 orders, the cart gate loses 60% and the checkout gate loses 37.5%. The blended figure of 75% describes neither, and points at neither fix.
Why do shoppers abandon their carts?
Baymard reports that 42% of online shoppers in the United States abandon simply because they are browsing and not ready to buy, which no design fixes. Among the rest, 40% cite extra costs such as shipping, tax and fees being too high, 20% slow delivery, 19% not trusting the site with card details, 18% a required account and 17% a checkout that runs too long. Four of those five are decisions a store made deliberately.
How much is one point of cart abandonment worth?
Multiply carts created over the year by 0.01 and by your average order value. On a store with 12,000 carts a year and a €68 average order, one point is 120 orders and €8,160 in revenue, or €3,672 in margin at a 45% gross margin. Ten points is €81,600 a year, the same gain as moving the conversion rate from 1.0% to 1.4% without buying a single extra visit.
That's what the Conversion Audit maps: five business days, $500, and the map is yours whether or not you hire us.
Your store, five days.
$500. Zero commitment. Yours either way.