
Customer cohort analysis: the cost of two launch cohorts
Compare customer cohorts by launch over equal 90-day windows. Price the second-order gap before deciding which launch deserves a closer look.

Customer cohort analysis groups customers with a shared starting point. For a store that sells in drops, that starting point can be the launch that brought their first order. Follow each group for the same 90 days. The comparison shows which launch brought customers who returned, and how much that difference is worth before your next launch.
Take two launch cohorts of 400 first-time customers each, at a €68 average order — the same store this blog uses throughout. One cohort places 60 second orders within 90 days. The other places 88. The blended rate across both, 18.5 percent, tells you nothing about which launch to study and which to repeat.
The first comparison needs three columns: the launch, its first-time customers, and the share who ordered again within 90 days. Keep every customer in the original group, including those who never returned.
Customer cohort analysis follows customers with a shared starting point. For a store selling in drops, each launch can define a group. Compare second purchases and revenue across equal, completed observation windows. That separates each launch's performance from a blended average, while leaving acquisition costs and causes to investigate before changing spend.
Key takeaways
- A blended retention rate can average a strong launch into a weak one, hiding which cohort needs attention.
- Define each launch cohort by first purchase, then compare second orders across equal, completed 90-day windows.
- Two cohorts of 400 customers each, 60 versus 88 second orders within 90 days, is a €1,904 gap before margin on one launch.
- The gap scales with the size of your next launch divided by 400, not with guesswork.
- Request two complete launch cohorts and their acquisition costs before committing the next launch budget.
What customer cohort analysis actually replaces
A blended repeat purchase rate can combine customers from different launches. Those customers may have seen different offers and product lines. They may also have had different amounts of time to return. The aggregate describes the combined group. It does not identify which launch deserves a closer look. The repeat purchase rate article uses an annual window; this example follows launch cohorts for 90 days. Those two windows answer different questions.
Customer cohort analysis follows a defined group from its first purchase. Shopify's Customer Cohort Analysis report groups customers by first-order date. A calendar month can be a useful starting view. It is not automatically a launch: two drops in one month need separate groups if you want to compare them.
Across the declared example's 800 customers, 148 place a second order: 18.5 percent. That aggregate hides 60 of 400 in one launch and 88 of 400 in the other. The separate rates are 15 and 22 percent. Neither is labeled good or bad against a market benchmark. Their difference is the question to price.
Reading customer cohort analysis in three columns
A cohort table built for an owner needs three columns, not forty:
Launch cohort | First-time customers | Share with a second order in 90 daysChannel and product splits can help investigate a difference. They do not need to obscure the first comparison between whole launches. The three columns show where to look. A second view can then add acquisition costs, offers and product mix to test possible explanations.
The temptation, once the cohort table exists, is to split it further — by channel, by discount code, by device — before a single comparison between two whole cohorts has been made. At 400 customers per cohort, a channel split can leave each slice too small to mean anything. Read the three columns first. Split further only once a gap between cohorts is large enough to be worth explaining.
The same reading problem shows up outside cohort tables, too — in the session recordings nobody watches as much as in a cohort report nobody opens.

Where cohort comparisons go wrong
Two launches rarely differ by acquisition timing alone. Before crediting the gap to whatever changed between Launch 1 and Launch 2, rule out the confounders a cohort table doesn't show on its own. A heavier discount on one launch inflates first orders without improving the customer's intent to return. A seasonal month — a holiday, a weather shift for a seasonal category — moves reorder timing independent of anything you did. A channel mix skewed toward paid social in one cohort and email in the other changes baseline intent before product or onboarding enters the picture.
These differences narrow what you can claim. Even comparable launches give you an observational comparison, not proof of causation. Both groups also need their full 90-day window, measured from each customer's first order. A recent launch with only 30 days of history cannot fairly be compared with one observed for 90. Price the gap first; investigate its cause before reallocating spend.
The worked example: two launch cohorts, priced
Two launches, 400 first-time customers each, same store — €68 average order, 45 percent gross margin:
- Cohort A (Launch 1): 60 of 400 place a second order within 90 days — 15 percent.
- Cohort B (Launch 2): 88 of 400 place a second order within 90 days — 22 percent.
This is a declared example, not a measured Flamel result. Each returning customer places one second order at €68. The 28-order difference is €1,904 in revenue before margin. Third orders are outside this simplified calculation. A second order adds value to the relationship, but it does not prove that the customer will keep buying indefinitely.
The comparison also informs lifetime value. But 90-day revenue is not lifetime profit. Acquisition cost, discounts, refunds and margin still matter. A higher reorder rate is a reason to investigate a launch's economics, not automatic permission to buy more of its customers.
Reading two cohorts side by side identifies the launch to investigate. It does not identify the fix or promise the stronger result. That's the kind of reading The Conversion Audit is built to do. Five business days, $500, and the map is yours whether or not you hire us.
What one cohort gap is worth by Monday
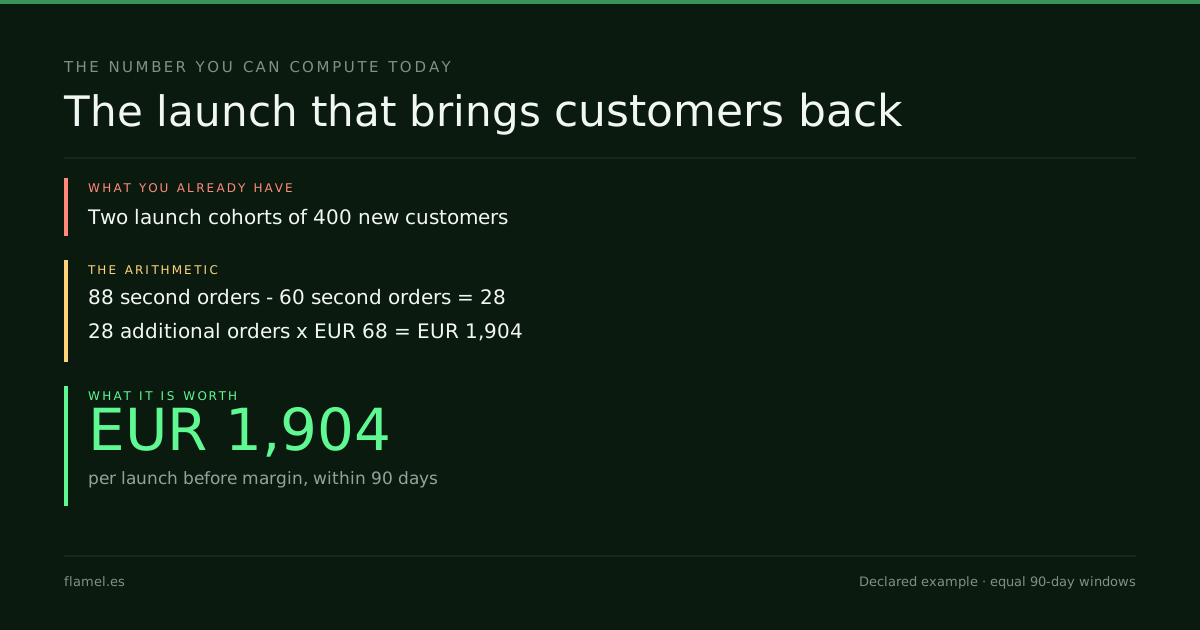
Cohort value at 90 days = revenue from the cohort's customers in their first 90 days ÷ customers in the cohortIn this declared example, each first order and second order is €68. Cohort A produces (400 + 60) × €68 = €31,280. Cohort B produces (400 + 88) × €68 = €33,184. Divide each by 400 customers: €78.20 against €82.96 per customer at day 90. The difference is €4.76 per acquired customer, or €1,904 across 400. At 800 new customers, the same difference would be €3,808. That is a scenario assuming comparable conditions, not a forecast or promised gain.
That figure prices the question for your next planning meeting. It is revenue before margin, not a spending allowance. Compare acquisition costs and contribution margin before deciding whether to change the offer, the channel or the post-purchase experience.
At the example store's 45 percent gross margin, €1,904 produces €856.80 in gross profit before any additional operating costs. Even that amount is not guaranteed savings. Discounts, refunds and differences in acquisition spend can change the comparison. The revenue line starts the decision; it does not finish it.
For your next review, request two launch cohorts with complete, equal windows. Ask for their acquisition cost and 90-day revenue per customer. Those figures show which launch merits investigation before the next budget repeats. In the simplified example, the second-order gap alone is 28 × €68 = €1,904 per launch before margin.
Work through this with your own numbers
You are reviewing retention data for a direct-to-consumer store. You have [your average order value], [your gross margin], and two recent launch cohorts: [customers acquired in launch 1], [how many placed a second order within 90 days in launch 1], [customers acquired in launch 2], [how many placed a second order within 90 days in launch 2]. Calculate the reorder rate for each cohort, the gap in second orders between them, and the revenue gap using your average order value. State which launch performed worse and by how much money, before margin. Then project that gap onto [expected new customers in your next launch] by scaling it proportionally. Finally, list the additional evidence needed to explain the gap, including acquisition cost, discounts, refunds, category and season. Do not infer a cause or recommend a specific change from the gap alone. Treat the scaled difference as a scenario, not a forecast.FAQ
What is customer cohort analysis in ecommerce?
Customer cohort analysis follows customers who share a starting point or characteristic. For this store, each launch defines an acquisition cohort. The article compares second purchases and revenue over the first 90 days. Monthly groups are useful when they match the decision; separate launch groups are needed when a month contains more than one drop.
How is cohort retention analysis different from a repeat purchase rate?
A repeat purchase rate is usually reported as one number across all customers over a trailing period, often 12 months. Cohort retention analysis breaks that same metric down by acquisition month, so a launch that underperforms doesn't hide inside a number carried by a stronger cohort acquired three months earlier.
Does Shopify have a native cohort analysis report?
Yes. Shopify documents a Customer Cohort Analysis report in Analytics. By default, it groups customers by first-order date and follows repeat purchases over subsequent periods. That provides an acquisition-cohort view. If your store runs several drops in one month, a monthly row alone does not distinguish those launches.
What window should I use for cohort analysis — 30, 90 or 365 days?
This article uses 90 days for its declared example. Your category may need a shorter or longer window. The relevant window depends on how often customers need the product again. Hold the definition constant and wait until both cohorts have completed it. A shorter window is not inherently wrong; it answers an earlier-stage question.
How many customers do I need in a cohort before the numbers mean anything?
There's no universal minimum, but a cohort of a few dozen customers moves several percentage points on a single reorder. Treat small cohorts as directional, not decisive, and wait for a second launch of comparable size before concluding the first one is a trend rather than noise.
That's the kind of reading the Conversion Audit is built to do. Five business days, $500, and the map is yours whether or not you hire us.
Your store, five days.
$500. Zero commitment. Yours either way.