
Repeat purchase rate: the second order
Repeat purchase rate is the share of customers who order twice. The formula takes one line; what one point of it is worth takes a calculation.
Repeat purchase rate is the share of customers who order more than once: buyers with at least two orders, divided by everyone who ever ordered, inside a fixed window. On a store with 1,875 customers and 3,000 orders a year, where 750 people came back, the rate is 40%. That is the whole formula.
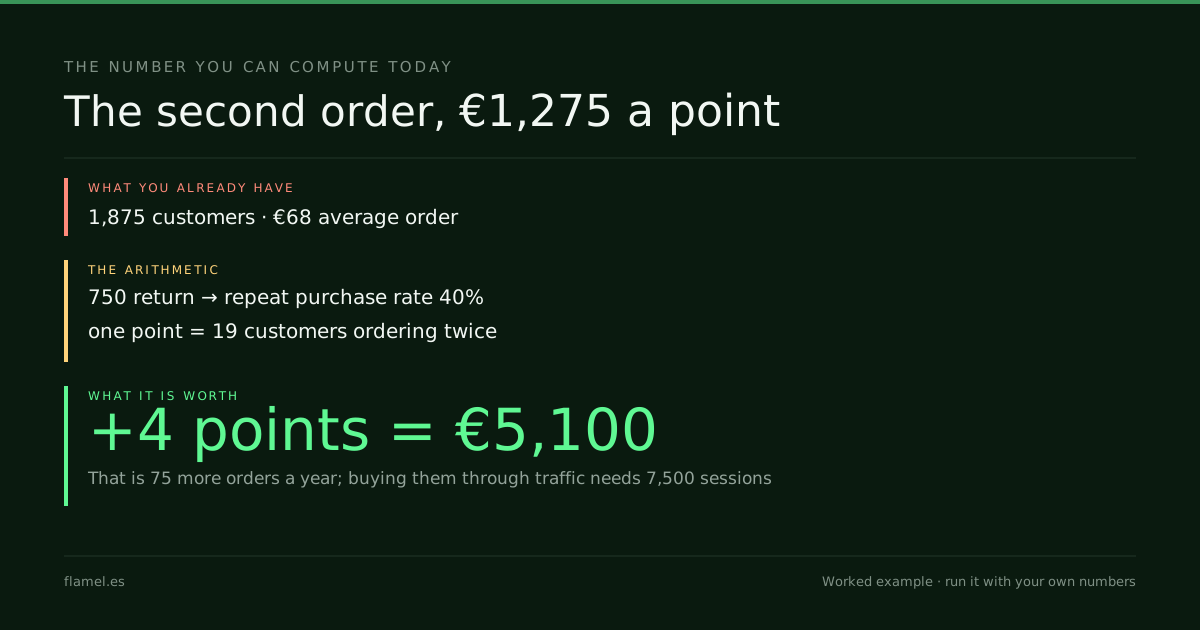
The useful part is what the rate is worth. One point of it, on that same store, is €1,275 a year in revenue that arrives without buying a single extra session. Four points is €5,100.
What follows is the formula, the reason the benchmark you will find online is measuring something slightly different, and the one number to carry into your own spreadsheet.
Repeat purchase rate is the percentage of customers who place more than one order in a period: customers with at least two orders divided by all customers who ordered. A common benchmark neighborhood is the low-to-mid twenties, but it varies widely by product type and the exact window chosen.
Key takeaways
- Repeat purchase rate is customers with two or more orders divided by all customers who ordered, inside a fixed window.
- Published benchmarks usually report retention rate, which uses a different base: the two figures are not comparable.
- On a store with 1,875 customers and an average order of €68, one point of the rate is €1,275 a year.
- The same 75 extra orders bought through traffic would need 7,500 more sessions, each one paid for.
- The second order is decided between the thank-you page and the parcel, the least designed stretch of most stores.
The repeat purchase rate formula, in one line
Repeat purchase rate = customers with two or more orders ÷ total customers who ordered, over a chosen window, expressed as a percentage.
Three decisions hide inside that line, and they are what make two stores' numbers incomparable:
- The window. A rolling twelve months is the common choice. A store selling something bought once a quarter and a store selling something bought once every three years cannot use the same window and mean the same thing.
- The base. The denominator is customers, not orders and not sessions. A store that counts orders in the denominator will report a number that looks like the metric and behaves like a different one.
- The threshold. Two orders is the standard bar. Some teams count three, on the argument that the second order can be an accident and the third is a habit. Either is defensible; mixing them across quarters is not.
Fix those three and the rate becomes comparable against the only benchmark that matters, which is the same store last quarter.
Why the benchmark you find is the wrong number
Search for a target and two numbers come back, measured on different bases.
Klaviyo defines the metric the way the formula above does: customers with at least two purchases, divided by total active customers — everyone who has placed at least one order.
Shopify's industry table, updated in September 2026, reports an average retention rate of 27.4% across seven retail sectors, with health and beauty highest at 41.2% and jewelry lowest at 19.1%. But it calculates retention as customers at the end of the period, minus customers acquired during it, divided by customers at the start.
Those two formulas do not answer the same question. One counts people who bought twice. The other counts people who were still there at the end of a window. A store can score well on the first and badly on the second, and the gap between them is not an error — it is two different questions with similar names.
So the industry figure is a sanity check on the order of magnitude, not a target. Twenty-something percent is the neighborhood. Where inside it a given store belongs depends on what it sells: coffee and supplements come back every few weeks, mattresses and cameras do not. A rate that would be alarming for a consumable is unremarkable for something bought once a decade.
What one point of repeat purchase rate is worth
This is the part worth the meeting. Take the store used throughout this blog: 300,000 sessions a year, an average order of €68, a conversion rate of 1.0% — which is 3,000 orders — and 1.6 orders per customer across twelve months.
Those 3,000 orders come from 1,875 customers. If 750 of them ordered more than once, the repeat purchase rate is 40%: the other 1,125 bought a single time, and the 750 who returned placed 2.5 orders each. That 40% sits well above the published tables, which is the section above doing its job — those tables measure retention on a different base, and this store sells something people run out of.
Now move the rate by one point. One point of 1,875 customers is roughly 19 people placing one more order:
- 19 extra orders × €68 = €1,275 a year
Move four points, from 40% to 44%, and 75 customers place that second order:
- 75 extra orders × €68 = €5,100 a year
- At a gross margin of 45 cents on the euro, that is €2,295 of margin
Here is the comparison that changes the planning meeting. To buy those same 75 orders through traffic, at a conversion rate of 1.0%, a store needs 7,500 more sessions — and it pays for every one of them. The repeat orders arrive against a customer acquisition cost of zero, because the customer was already paid for once.
One honesty check on that arithmetic: it credits each newly returning customer with exactly one additional order, which is the conservative reading. On this store the customers who do come back average 2.5 orders, so a real four-point move would land above €5,100, not below it.
That is also why this number sits underneath customer lifetime value: lifetime value is what a customer is worth across all orders, and repeat purchase rate is the lever that decides how many orders there are to add up. Move it and the LTV:CAC ratio improves from the numerator, which is the cheaper side to move.
Where the second order is actually decided
The second order is usually lost before anyone thinks about winning it, in the stretch between the thank-you page and the parcel arriving. That window is the least designed part of most stores and the one the customer is paying closest attention to.
The payoff for closing it is measurable: Shopify's table notes that once someone has ordered twice, they are 95% more likely to order again. The second order is not one more order — it is the one that changes the odds on every order after it.
Three places it leaks, in the order they cost money:
- The gap after checkout. The confirmation email is a receipt when it could be the first page of the relationship: what was ordered, when it arrives, what to do if it does not.
- The moment the product is first used. A customer who does not get the result the product promised will not order again, and will not complain either. Most stores never find out.
- The second-order prompt that arrives at the wrong time. Sent too early it is noise; sent after the habit has lapsed it is archaeology. The right interval is the replenishment cycle of the product, which is measurable from existing order data.
None of this is a channel problem. It is a design problem in the part of the store that comes after the money, which is also the part of the store that is easiest to change and gets looked at last. It belongs in the same audit as the four places a store leaks revenue, not in a separate retention project.
The number to take to your own data
One calculation, three inputs, all of which a store already has:
- Count customers who ordered at least twice in the last twelve months.
- Divide by all customers who ordered at all in that window. That is the rate.
- Multiply one percent of the customer count by the average order value. That is what one point is worth in a year.
On the worked store the answer is €1,275 per point. Run it on real numbers and the output is a euro figure per point, which is the form the number has to be in before it can compete with anything else on the roadmap.
Work through this with your own numbers
Act as an ecommerce analyst. I will give you my store's numbers and I want the repeat purchase rate and what one point of it is worth in a year. My numbers: total customers who ordered in the last twelve months is [CUSTOMERS], of whom [REPEAT CUSTOMERS] placed two or more orders. My average order value is [AVERAGE ORDER VALUE] and my gross margin is [MARGIN PERCENT]. Calculate: the repeat purchase rate; the revenue and the margin that one additional point would produce in a year; and how many extra sessions I would need to generate the same number of orders through traffic at my conversion rate of [CONVERSION RATE]. Show the arithmetic line by line so I can check it, and tell me which of the three inputs my answer is most sensitive to.FAQ
What is a good repeat purchase rate?
The industry neighborhood is the low-to-mid twenties, but the figure depends on what the store sells. Consumables bought every few weeks sit far above a category bought once a decade. The only benchmark that decides anything is the same store one quarter earlier, measured the same way.
Is repeat purchase rate the same as customer retention rate?
No. Repeat purchase rate divides customers with two or more orders by all customers who ordered. Retention rate divides customers still active at the end of a period by those at the start. They answer different questions, so a figure published as one cannot be compared against the other.
What window should the calculation use?
A rolling twelve months suits most stores because it absorbs seasonality. The real rule is that the window has to be longer than the product's natural repurchase cycle, or the calculation counts customers as lost who simply have not run out yet.
Does the denominator use customers or orders?
Customers. Using orders produces a number that looks like the metric and moves for the wrong reasons, because a handful of frequent buyers can lift it while the share of people who ever come back stays flat.
Flamel runs the Conversion Audit on stores that already have traffic and want to know what each leak costs before touching the design. See how it works in the Conversion Audit.
Your store, five days.
$500. Zero commitment. Yours either way.