
Feature adoption rate: a release, in retention
Feature adoption rate alone is a leading metric with no price. Multiply it by churn gap and ARPU to know what a release is actually worth.

Feature adoption rate is the share of eligible users who turn on and keep using a given feature: adopters divided by eligible users, over a stated window. On its own it tells you nothing you can spend. A release adopted by 20% of your base is worthless until you know what each adopter is worth in retained revenue.
Product teams chase feature adoption rate because it's a leading metric: fast to measure, early to move, easy to put on a dashboard. In a product-led growth model, where the product does the selling, it is often the first number a release is judged on. But a leading metric only matters wired to a lagging one — usually retention or revenue. A feature can clear 20% adoption and still not matter, or clear 8% and fund next quarter's roadmap. The difference is churn gap and ARPU, not the adoption percentage by itself.
Take a SaaS product with 1,100 customers, inside the 150k–3M € ARR band Flamel audits. A release pulls in 220 adopters. Twenty percent is the start of the sentence, not the end of it.
Feature adoption rate equals adopters divided by eligible users, over a defined window. Alone, it's a leading metric with no financial meaning. It becomes useful only once multiplied into a release value formula — adopters × churn gap × ARPU × 12 — which converts a percentage into recurring revenue protected.
Key takeaways
- Feature adoption rate is a leading metric: it measures attention, not revenue, and means nothing until it's priced.
- The same 20% adoption rate can be worthless or worth thousands a month, depending on the churn gap it closes.
- Release value = adopters × churn gap × ARPU × 12 turns a percentage into annual recurring revenue protected for each month the gap holds.
- On one product, 220 adopters with a two-point churn gap protect €3,168 of ARR for every month the gap holds.
- Pull your last release's adopter count, its churn gap versus non-adopters, and your ARPU, then run the formula before reporting it upward.
Why feature adoption rate alone tells you nothing
Adoption rate answers one question: who turned the feature on and kept using it. It does not answer whether those adopters churn less, spend more, or refer anyone. A product analytics guide on feature adoption documents the metric in detail — cohorts, time-to-adopt, drop-off — without ever pricing what a point of adoption is worth. That's the gap this post closes.
The number is real. Track it weekly, segment it by signup cohort, watch it decay. None of that makes it a business metric. It's an input, not an output. Most dashboards stop at the percentage because the percentage is easy to screenshot for a board update. Nobody asks what the screenshot is worth until the quarter it doesn't move revenue, and by then the release has shipped, the team has moved on, and the adoption number sits in a slide with no denominator attached to money.
The same trap catches feature adoption metrics plural, not just the single-release version: a quarterly review that lists six features and their adoption percentages, ranked high to low, with no column for what any of them protected. Ranked that way, the list rewards whichever feature was easiest to notice, not whichever feature earned its build cost back.
Leading metrics need a lagging partner
Leading indicators look forward; lagging indicators confirm what already happened. Feature adoption rate is leading: it moves within days of a release. Churn and expansion revenue are lagging: they confirm months later whether the leading signal meant anything.
A north star metric is supposed to be the bridge between the two — the one number a team watches weekly that correlates with the lagging outcome the business actually needs. Pick it badly and every leading metric underneath it, including adoption rate, reports progress on the wrong thing. That's the failure mode this blog's north star metric piece names directly: an activity count that climbs on its own and orients the team wrongly, when the test of a north star is whether one point of it can be written in euros.
The pairing works both ways. A lagging metric with no leading partner only tells you what already happened, too late to act on. A leading metric with no lagging partner, which is what a bare adoption rate is, tells you something moved without telling you if it mattered. Neither half is useful alone; the formula below is what wires them together for one release at a time, instead of waiting a full quarter to find out which releases earned their build cost.

The worked example: 220 adopters, priced
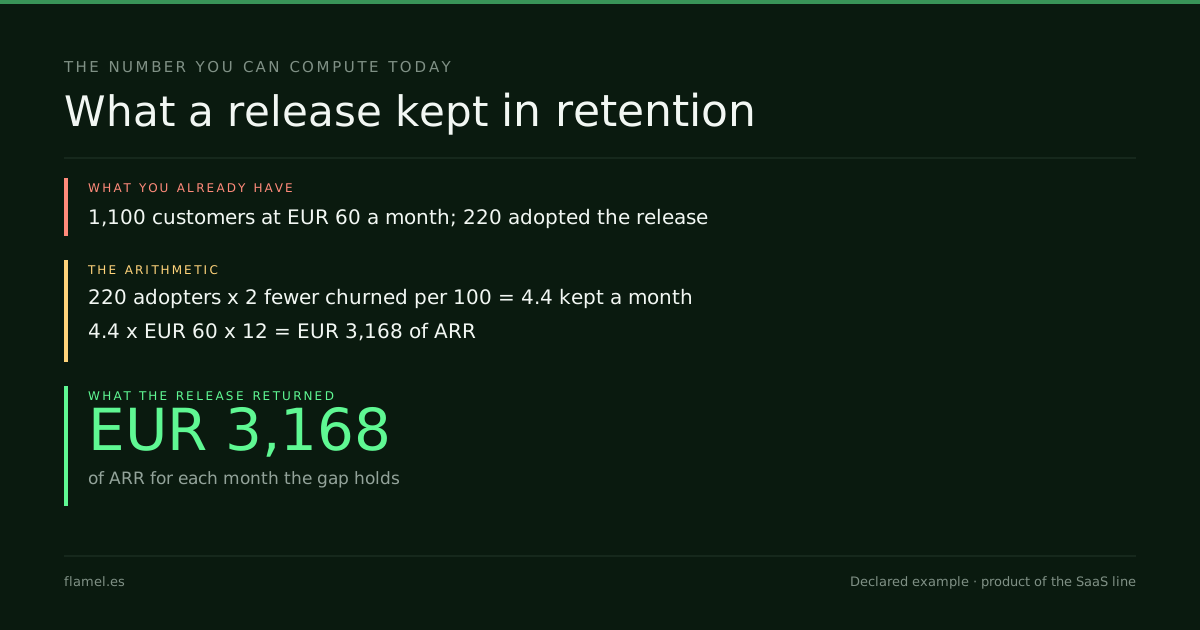
Here is the product again: 1,100 customers, a release adopted by 220 of them (20%), and a cohort comparison showing those 220 churn two points slower per month than non-adopters. Monthly ARPU on this product runs €60.
Release value = adopters × churn gap × ARPU × 12
= 220 × 0.02 × €60 × 12
= €3,168 of ARR protected per month the gap holds
The adoption rate — 20% — never appears in that formula except as the count of adopters. It's the headcount, not the price tag. A different release at 8% adoption but a three-point churn gap gets more than half of it back: 88 adopters × 0.03 × €60 × 12 = €1,901, from two-fifths of the adopters.
| Release | Adoption rate | Adopters | Churn gap | ARPU | ARR kept per month of gap |
|---|---|---|---|---|---|
| A | 20% | 220 | 2 pts | €60 | €3,168 |
| B | 8% | 88 | 3 pts | €60 | €1,901 |
| C | 35% | 385 | 0.5 pts | €60 | €1,386 |
Release C has the highest adoption rate on the table and the lowest value protected. Reported on adoption alone, it would look like the quarter's win. Priced, it's the weakest of the three, and the one most likely to get a second engineering sprint it hasn't earned.
This is also why time to first value matters here: a feature adopted slowly, past the window where time to value is measured, rarely shows the same churn gap. Adoption that arrives late tends to price lower, because the users who needed it most already decided without it, on a competitor or on a workaround that cost them nothing to keep using.
Where feature adoption rate fits your north star
Feature adoption rate is a tracking metric for a single release. It is not, and should never be, the north star itself — it has no denominator that includes revenue or retention. Use it to decide which releases to study further, then run every candidate through the churn-gap-and-ARPU formula before reporting it upward as a win.
Activation rarely breaks once. It breaks at signup, in the first session, in the steps before a user reaches first value, and again in week two — and feature adoption rate is the instrument for that last break. A release that moves the churn gap is the release that gives week two a reason to open the product again. A release that only moves the adoption percentage is a release nobody needed badly enough to stay for.
A checklist before a release gets reported upward
- Adoption rate calculated over a named window (30 or 90 days, never mixed).
- Adopter churn measured against a same-window non-adopter cohort, not the account-wide average.
- Churn gap expressed in points, not percent-of-percent.
- ARPU taken from the same customer segment as the adopters, not the blended company average.
- Release value run through the formula before the number reaches a board deck.
What one point of churn gap is worth
Run the same formula at a one-point churn gap instead of two, same product: 220 × 0.01 × €60 × 12 = €1,584 of ARR for each month the gap holds. Half the gap, half the value. The formula is linear in churn gap, which is why a release with a three-point gap on two-fifths of the adopters still protects more than that.
What to do by Monday: pull the adopter count for your last shipped feature, the churn rate of adopters versus non-adopters over the same window, and your monthly ARPU. Run adopters × churn gap × ARPU × 12. That number, not the adoption percentage, is what you report to the board.
Work through this with your own numbers
You are a SaaS operator reviewing the last feature your team shipped. Here is the data: adopters are [number of users who turned on the feature], eligible users are [total users who could have used it], the churn rate of adopters is [adopter monthly churn %], the churn rate of non-adopters over the same window is [non-adopter monthly churn %], and monthly ARPU is [your average revenue per user]. Calculate feature adoption rate as adopters divided by eligible users. Then calculate release value as adopters × (non-adopter churn − adopter churn) × ARPU × 12. Report both numbers. If release value is under [your minimum threshold to justify the release], say what you would deprioritize next quarter instead, and name one feature currently in the backlog with a larger plausible churn gap.FAQ
What is a good feature adoption rate?
There is no universal good rate. A 20% adoption rate that closes a two-point churn gap protects €3,168 of ARR for each month the gap holds; a 35% adoption rate that only closes a half-point gap protects €1,386. The first reaches fewer users and is worth more than twice as much. Judge a release by adopters × churn gap × ARPU × 12, not by the raw percentage. Compare releases against each other on that formula, not against a published benchmark that was never measured on your product.
How do you calculate feature adoption rate?
Divide the number of users who turned on and kept using a feature by the number of eligible users, over a stated window — usually 30 or 90 days. The window matters: a feature measured at day 7 will show a lower rate than the same feature measured at day 90, and the two numbers aren't comparable without naming the window.
Is feature adoption rate a leading or lagging metric?
Leading. It moves within days of a release and predicts, but doesn't confirm, a business outcome. Churn rate and expansion revenue are the lagging metrics that confirm whether the adoption actually mattered. Report leading metrics internally to steer; report lagging ones, priced, to the board.
How does feature adoption rate relate to a north star metric?
A north star metric is the single number that should correlate with retained revenue; feature adoption rate is one of several inputs that feed it. If a north star is chosen for visibility rather than correlation, adoption rate reports progress against the wrong target, even while climbing.
How often should you measure feature adoption rate?
Weekly for the first quarter after a release, to catch early drop-off, then monthly once the rate stabilizes. Pair every measurement with the churn-gap comparison between adopters and non-adopters — adoption rate without that comparison only tells you who clicked, not who stayed.
Flamel reads the activation data with your access and prices which releases actually protect revenue. That's what the Activation Audit is. Five business days, $500, and the map is yours whether or not you hire us.
Your store, five days.
$500. Zero commitment. Yours either way.