
Freemium conversion rate: free users, priced
Freemium conversion rate is paying customers divided by free signups from the same cohort. The benchmark, the window, and what one point is worth.

Freemium conversion rate is the share of free signups who become paying customers: new paying customers divided by free signups from the same cohort, inside a fixed window. In Lenny Rachitsky's survey of more than 1,000 products, a self-serve freemium product converting 3 to 5 of every 100 signups within six months is good, and 6 to 8 is great.
The window is the part most teams skip. Divide this month's upgrades by this month's signups and the rate mixes people who signed up last week with people who signed up last spring. Measured by cohort, it is also the one number that marketing, which counts the signups, and product, which counts the upgrades, can own together.
Freemium conversion rate is new paying customers divided by free signups from the same cohort, measured over a fixed window such as six months. For a self-serve freemium product, 3 to 5 of every 100 is good and 6 to 8 is great. Measure by signup cohort, not by calendar month.
Key takeaways
- Freemium conversion rate is new paying customers divided by free signups from the same cohort, over a fixed window.
- For self-serve freemium, 3 to 5 of every 100 within six months is good and 6 to 8 is great.
- A monthly ratio mixes cohorts: a campaign month can halve it with nothing changed.
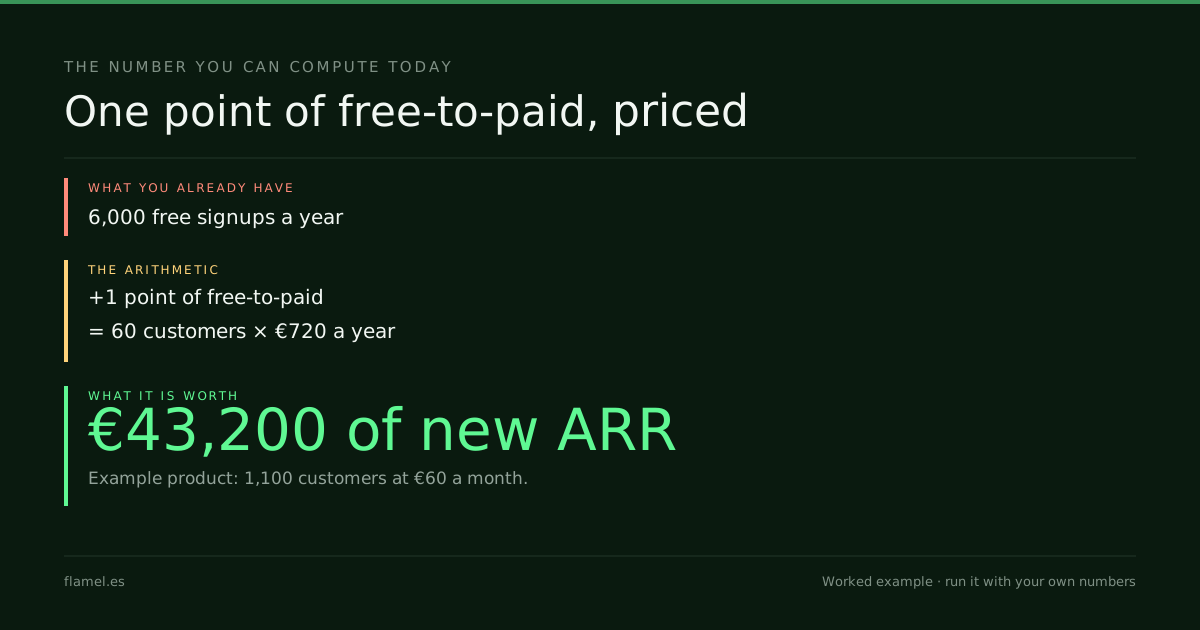
- On the example product, one point is 60 customers a year: €43,200 of new ARR.
- The payers are decided in the first week, by who reaches the first useful result.
The freemium conversion rate formula, by cohort
Free-to-paid rate = signups who start paying within the window ÷ free signups in the cohort × 100Lenny defines it as the percentage of new accounts that end up paying in their first six months, and recommends measuring it on a cohort basis. A cohort is everyone who signed up in the same month. The window is fixed in advance and stays the same from cohort to cohort: six months is the one his data uses.
Two cohorts measured over different windows are two different numbers. A product that counts upgrades at 30 days in one quarter and at 90 days in the next will see its rate jump without anything in the product changing.
Why the monthly ratio misleads
Take a product with 500 free signups a month and a steady 25 upgrades a month from earlier cohorts: 5 of every 100, read the quick way. Then a campaign doubles signups to 1,000 in one month.
That month, upgrades still come in at about 25, because most of the campaign's signups have not had time to decide. The quick ratio reads 2.5 of every 100, the rate looks halved and the campaign gets the blame. Six months later the campaign cohort shows its real rate, which may be the same 5 or may be lower if the campaign brought the wrong people. Only the cohort can say which.

What a good rate looks like
Lenny's survey, published in August 2023 and focused on software sold to companies, gives these bands for conversion within six months:
| Model | Good | Great |
|---|---|---|
| Self-serve freemium | 3 to 5 of every 100 | 6 to 8 of every 100 |
| Freemium with sales assist | 5 to 7 of every 100 | 10 to 15 of every 100 |
| Free trial | 8 to 12 of every 100 | 15 to 25 of every 100 |
The spread inside freemium is wide: a fifth of the products in the survey convert fewer than 2.5 of every 100. OpenView's 2022 benchmarks, as Amplitude reported them, point the same way: companies with a free trial typically see higher conversion rates, and OpenView's Kyle Poyar adds that freemium companies typically get more signups. A freemium rate is read against the freemium band, never against a trial's.
What the ones who pay did first
The free tier is where a product shows what makes people stay. The few who upgrade did something in their first sessions that the rest never reached.
Take one cohort of 500 free signups, as a declared example. 25 pay within six months. 100 of the 500 reached the product's first useful result in their first week, and 20 of the 25 payers are among them. That is 20 of every 100 for the ones who got there, against about 1 of every 100 for the 400 who did not.
On those numbers the rate is decided in the first week, long before anyone sees the paywall. It is the gap that time to value measures, and the reason the first session is worth pricing before it is redesigned. Marketing decides who enters the cohort; product decides how many reach that first result. That shared ownership is what product led growth depends on.
One point of freemium conversion, priced
The example product used across this blog's SaaS posts: a subscription tool for small creative businesses, with 1,100 customers paying €60 a month, or €720 a year. Run with a free tier of 6,000 signups a year:
- One point of free-to-paid = 60 more paying customers a year
- 60 × €720 = €43,200 of new ARR, about 5.5% of the product's €792,000 ARR
That is run-rate, not cash. At 4 of every 100 customers leaving each month, a new customer bills about €581 in their first twelve months, so the point brings in about €34,860 across those twelve months.
The number to take to your own cohorts
- Group free signups by the month they signed up.
- For each cohort, count the ones who started paying within six months and divide by the cohort.
- Multiply 1 of every 100 yearly free signups by your yearly price.
The result is what one point of freemium conversion is worth to you in new ARR, which is the figure a change to the first week has to beat.
Work through this with your own numbers
You run a SaaS product with a free plan and a paid plan at [yearly price] a year. Here are your free signups by month for the last twelve months: [signups per month], and for each monthly cohort, how many started paying within six months: [payers per cohort]. Calculate the freemium conversion rate of each cohort as payers divided by signups, and say whether it is rising or falling once the cohorts are compared over the same window. Then calculate what one point of conversion is worth in new ARR as one of every 100 yearly free signups times the yearly price. If I give you [share of each cohort that reached the first useful result in week one], tell me how the conversion of those users compares with the rest, and what that says about where to work first.FAQ
What is a good freemium conversion rate?
For a self-serve freemium product, Lenny Rachitsky's survey of more than 1,000 products puts good at 3 to 5 of every 100 free signups paying within six months, and great at 6 to 8. With a sales team assisting, good is 5 to 7 and great is 10 to 15. A fifth of freemium products convert fewer than 2.5 of every 100.
How do you calculate freemium conversion rate?
Group free signups into cohorts by the month they signed up. For each cohort, count the signups who started paying within a fixed window, such as six months, and divide by the size of the cohort. Keep the same window for every cohort so the numbers can be compared.
Is freemium conversion lower than free trial conversion?
Usually. In Lenny Rachitsky's survey a good free trial converts 8 to 12 of every 100 signups, against 3 to 5 for self-serve freemium, and OpenView's 2022 benchmarks point the same way. Freemium products typically get more signups, so each model is read against its own band.
Why does freemium conversion drop after a campaign?
Often it does not. A campaign adds signups in one month while the upgrades counted that month come from earlier cohorts, so a monthly ratio falls even if nothing changed. Wait until the campaign cohort has completed its window and compare it with the cohorts before it.
Following a free account from signup to the paywall, and finding where each cohort stops, is part of what The Activation Audit maps. Five business days, $500, and the map stays with you whether or not you hire anyone next.
Your store, five days.
$500. Zero commitment. Yours either way.