Growth loops: when the work brings the next user
Growth loops turn what customers make into the next signup. A worked SaaS example: €9,504 of ARR a month from 66 loop signups, with no ad spend.

Growth loops turn the product's own output into the next signup. In a tool for creative businesses, much of that output is public: a photographer's gallery, a studio's booking page, an academy's course page, all seen by the customer's own clients. When that output carries the product to new people, product work becomes acquisition, and product and marketing share one channel.
Most SaaS teams still draw growth as a funnel that marketing fills and product drains. A loop changes who owns the number. The page a customer publishes is designed by product, seen by marketing's next audience, and measured by nobody.
The sum below runs on the example product this blog uses for SaaS, which is flat: marketing brings 44 customers a month and churn takes 44. It ends on what a loop is worth in ARR each month, before anyone touches the ad budget.
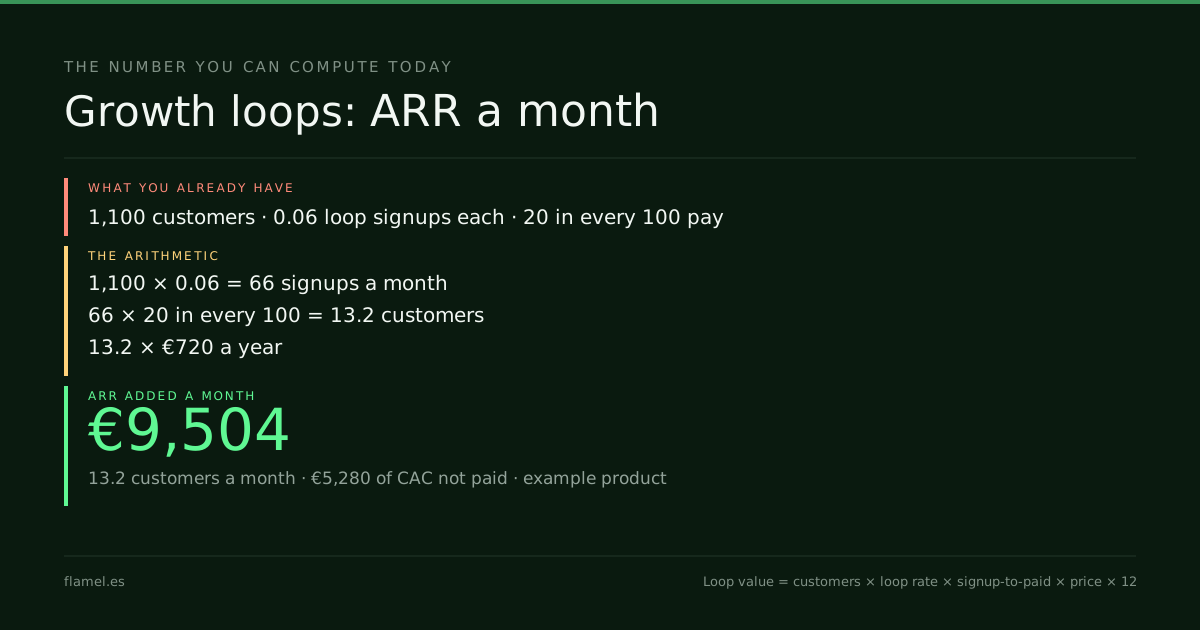
Growth loops turn what customers make with a product into new signups. On a product with 1,100 customers at €60 a month, 0.06 loop signups per customer a month bring 66 signups and, at 20 in every 100 paying, 13.2 customers: €9,504 of ARR a month and €5,280 of acquisition cost not paid.
Key takeaways
- Growth loops turn what customers make with a product into the next signup, so product work becomes acquisition.
- In tools for creative businesses, galleries, booking pages and portfolios are seen by the customer's own clients: the output is the channel.
- On 1,100 customers, 0.06 loop signups per customer a month bring 13.2 customers: €9,504 of ARR a month.
- The same 13.2 customers would cost €5,280 through marketing at a €400 acquisition cost.
- Tag last quarter's signups that first arrived from a customer's page, and divide by customers to get your loop rate.
What growth loops are, in one line
Reforge's 2018 essay on growth loops, by Brian Balfour, Casey Winters, Kevin Kwok and Andrew Chen, describes loops as “closed systems where the inputs through some process generates more of an output.” That output is reinvested as the next input. Funnels, the same essay says, operate in one direction, with “no concept of how to reinvest what comes out at the bottom.”
Its main example is Pinterest. A user saves content, and “Pinterest distributes the quality content to search engines.” A searcher finds it, signs up, and saves content of their own. The users' activity is the acquisition channel.
The kind that matters here is narrower: loops where the customer's work, not an invitation, brings the next user. Nobody asked the customer to refer anyone. They published a gallery, and the gallery did it.
The output is the channel
Kevin Kwok's essay Why Figma Wins shows the same shape in a design tool. “Sharing designs with Figma is as easy as sending a link.” “Designers who use Figma share their designs with engineers and PMs, introducing them to Figma.” And: “Many people work across companies, especially agencies, and spread Figma to their clients.”
A tool for creative businesses often has a wider audience than that. A photographer's client gallery is opened by every family or brand that hired them. A studio's booking page is used by every student who books a class. Some of those viewers run creative businesses of their own. What they see is the product working, on someone else's job.
That is where product-led growth stops being a pricing model and becomes a design brief. Whether the gallery says which tool made it, whether that line is a link, and whether the link lands on a page built for someone who just saw the product in use: product decides all three. Marketing usually owns none of them, and counts none of the signups they bring.

The worked example: 66 signups
The example product this blog uses for SaaS is a subscription tool for creative businesses with 1,100 paying customers at €60 a month (€720 a year). It gets 220 signups a month from 11,000 visits, and 20 in every 100 signups pay: 44 new customers. Churn is 4 in every 100 a month, so 44 customers leave. The product is flat. Its acquisition cost is €400 a customer. All of it is declared, not a client's numbers.
Now declare a loop: each month, the published work of 6 in every 100 customers brings one signup.
Loop signups:     1,100 customers × 0.06 = 66 a month
New customers:    66 × 20 in every 100 = 13.2 a month
ARR added:        13.2 × €720 = €9,504 a month
Those 13.2 customers would cost €5,280 to buy through marketing at the product's €400 customer acquisition cost. Through the loop, nobody paid for the click.
The flat product stops being flat. Marketing still brings 44, churn still takes 44, and the loop adds 13.2 on top. Each of them publishes work too, so next month's loop starts from a larger base. That is what makes it a loop and not a campaign.
The paid rate of 20 in every 100 is an assumption, and probably a cautious one. A signup who arrived after seeing the product used by someone they hired has already seen it work. Measure it before relying on it.
Whether new signups already arrive from customers' work, and what they do in their first two weeks, is part of what The Activation Audit maps in five business days, for $500.
What a loop changes in the unit economics
The loop changes the blended cost of a customer. On the example product, marketing spends €17,600 a month for 44 customers. With the loop, the same spend sits next to 57.2 new customers. The blended acquisition cost falls from €400 to about €308.
That moves the LTV:CAC ratio without touching price or retention. It also changes who should get credit. A signup that came through a customer's gallery shows up in analytics as direct or referral traffic, and is often credited to the last campaign. If nobody tags it, the loop is invisible, and the first budget cut may land on the product work that fed it.
Growth loops that both teams own
A loop has three steps, and each one can be measured:
- Exposure. How many people see a customer's output each month: gallery views, booking page visits, portfolio sessions.
- Click. How many of them follow the line or link back to the product.
- Signup and paid. How many of those sign up and pay, compared with signups from other channels.
Product owns the first two. Marketing owns the page the click lands on and the comparison in the third. Neither can improve the loop alone, which is why it deserves one shared number: loop signups per customer per month.
Before building anything, check whether the loop already exists. Many tools already put their name on customer pages. The question is whether anyone has counted what that line brings.
The growth loops number for your product
Loop value (ARR a month) = customers × loop signups per customer × signup-to-paid × monthly price × 12On the example product: 1,100 × 0.06 × 0.20 × €60 × 12 = €9,504 of ARR a month, and €5,280 of acquisition cost not paid.
What to do by Monday: list every page or file your customers share with their own clients. For each, check whether it names the product and links back. Then pull last quarter's signups and tag the ones whose first visit came from one of those pages. That count per month, divided by customers, is your loop rate today.
Work through this with your own numbers
You are reviewing whether a SaaS product has a growth loop. Inputs: [paying customers], [monthly price per customer], [signup-to-paid rate], [customer acquisition cost], [the pages or files customers share with their own clients] and [signups per month last quarter whose first visit came from one of those pages]. Calculate loop signups per customer per month. Then calculate the ARR the loop adds each month as customers × loop signups per customer × signup-to-paid × monthly price × 12, and what the same customers would cost through paid acquisition. Compare the paid rate of loop signups with other signups if I give you both. List the three steps of the loop (exposure, click, signup) and which team owns each. Do not assume a loop exists without a tagged count: say what data is missing.FAQ
What is a growth loop?
A growth loop is a closed system where the output of using a product becomes the input that brings new users. Reforge described it in 2018 as inputs that generate more output, which is reinvested. Its classic example is Pinterest: saved content reaches search engines, and searchers sign up.
What is the difference between a growth loop and a funnel?
A funnel runs in one direction: traffic in, customers out, and nothing returns to the top. A loop feeds its output back as the next input. When customers' work brings the next signups, product and marketing share the same channel.
What are examples of growth loops in SaaS?
Figma spreads when designers share files with engineers and product managers. A booking tool spreads when students use a studio's booking page. A gallery tool spreads when a photographer's clients open their photos. In each case, the customer's output reaches people who might use the product.
How do you measure a growth loop?
Count loop signups per customer per month: signups whose first visit came from a customer's page or file, divided by paying customers. Multiply by customers, the signup-to-paid rate and the annual price to get ARR a month. On 1,100 customers at 0.06, 20 in every 100 paying and €720 a year, that is €9,504.
Whether a product's output already brings signups, and what those signups do in their first weeks, is part of what The Activation Audit maps. Five business days, $500, and the map stays with you whether or not you hire anyone.
Your store, five days.
$500. Zero commitment. Yours either way.