
Product market fit survey: who would miss you
A product market fit survey asks one question: how would you feel without this product? How to run it, the 40 in 100 bar and how to read it by segment.

A product market fit survey asks customers one question: how would you feel if you could no longer use this product? The share who answer very disappointed is the fit signal, and 40 of every 100 is the usual bar. The number matters less than who gives it: the customers who would miss the product most are the ones who stay.
Most SaaS teams run the survey once, read the total and file it. Read that way, a score below the bar only says the product is not there yet. Read by segment, the same answers say which customers already have fit, what they get from the product, and who onboarding and campaigns should be built for next.
A product market fit survey asks how customers would feel if they could no longer use the product: very, somewhat or not disappointed. Divide very disappointed answers by respondents; 40 of every 100 is the usual bar. Read it by segment: the group that clears the bar is the audience that stays.
Key takeaways
- The product market fit survey asks one question: how would you feel if you could no longer use this product?
- Fit share is very disappointed answers divided by respondents; Sean Ellis found 40 of every 100 separates traction from struggle.
- Ask only customers who have used the core of the product at least twice in the last two weeks; around 40 answers give a direction.
- On the worked example, 96 of 300 answers is 32 of every 100: 24 short overall, while academies already clear the bar at 45.
- This month, run the survey and split the very disappointed answers by customer type before reading the total.
Product market fit survey: the question and the bar
The survey is Sean Ellis's. It asks one question with four answers:
- Very disappointed
- Somewhat disappointed
- Not disappointed (it isn't really that useful)
- N/A, I no longer use the product
After benchmarking nearly a hundred startups, Ellis found that companies that struggled to find growth almost always had fewer than 40 % of users answer very disappointed, and companies with strong traction almost always passed it, as First Round Review tells it. The score is one division:
Fit share = very disappointed ÷ respondentsKeep the N/A answers out of the count: they describe customers who have already left, which is a churn question, not a fit question. The survey is the qualitative half of how to measure product market fit: the repeat numbers count who stays, and the survey asks why.

Who to ask: the Sean Ellis test rules
The result depends on who answers. Learning Loop's write-up of the method lists Ellis's three conditions: people who have experienced the core of the product, used it at least twice and used it in the last two weeks. Learning Loop puts a directional reading at 40 to 50 qualified answers, and Superhuman's founder, Rahul Vohra, at around 40.
The conditions exist because a customer who has not reached the product's first useful result cannot miss it. Sending the survey to every signup mixes those people with the ones who have, and pulls the score down for a reason that belongs to onboarding, which is the problem time to value measures.
Three follow-up questions turn the score into something a team can use:
- What type of people do you think would most benefit from the product?
- What is the main benefit you receive from the product?
- How can the product be improved for you?
Reading the survey by segment
Superhuman's first score was 22 out of 100. Instead of reading it as a verdict, the team studied the very disappointed group to describe the customer who loved the product most, then rescored only the customers who matched that profile: 33. After three quarters of building for that group, the score reached 58, according to the same First Round account.
Two moves did the work. The very disappointed answers described the audience that already had fit, in their own words. The somewhat disappointed answers were split by whether the main benefit mattered to them; only the ones who valued it shaped what got built next. Those words are also the raw material of a positioning statement, and they should match who actually stays: set the segments next to their customer retention rate before acting on them.
A worked example: 24 answers short
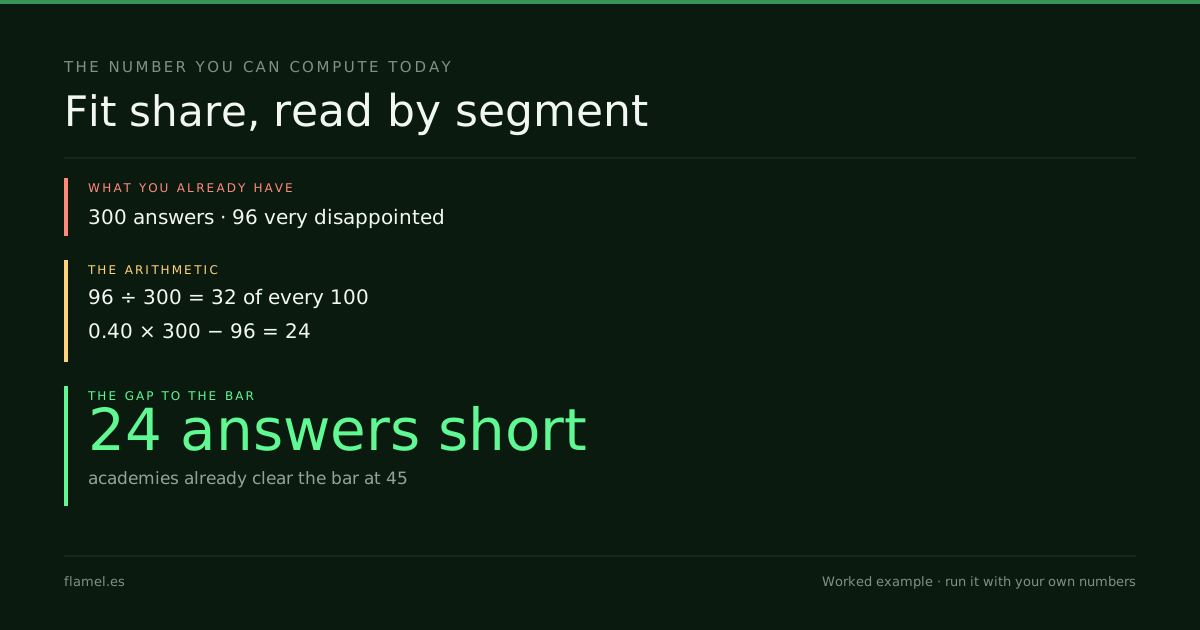
Take a subscription tool for creative studios, academies and photographers, with 1,100 customers paying €60 a month. The team sends the survey to the customers who used the core of the product at least twice in the last two weeks, and 300 answer. 96 say very disappointed: 32 of every 100, below the bar of 40.
| Segment | Respondents | Very disappointed | Fit share |
|---|---|---|---|
| Academies | 120 | 54 | 45 of every 100 |
| Studios | 100 | 28 | 28 of every 100 |
| Photographers | 80 | 14 | about 18 of every 100 |
| All customers | 300 | 96 | 32 of every 100 |
The gap to the bar is one line:
Gap to the bar = 0.40 × respondents − very disappointed answersOn this product, 0.40 × 300 − 96 = 24 answers. Read as a total, the product is 24 answers short. Read by segment, academies already clear the bar at 45 of every 100, and the other two segments do not. The next cycle starts there: onboarding and campaigns built around the benefit academies name, and a closer look at the somewhat disappointed studios who value that same benefit.
What to do this month: send the survey to customers who meet the three conditions, collect at least 40 answers, and split the very disappointed count by customer type before you look at the total.
Work through this with your own numbers
You run a SaaS product with [number of paying customers] customers paying [monthly price] a month, serving [customer types, for example studios, academies and photographers]. You sent the product market fit survey to customers who used the core of the product at least twice in the last two weeks. By customer type, you got [respondents per segment] answers and [very disappointed answers per segment] very disappointed answers. Calculate the fit share for each segment and in total as very disappointed answers divided by respondents, and the gap to a bar of 40 of every 100 as 0.40 times respondents minus very disappointed answers. Say which segment already clears the bar, what its customers name as the main benefit [paste their answers], and what onboarding and the next campaign should change to reach more customers like them.FAQ
What is a product market fit survey?
A short survey that asks customers how they would feel if they could no longer use the product: very disappointed, somewhat disappointed, not disappointed, or no longer using it. The share of very disappointed answers is the fit score. Sean Ellis designed it after benchmarking nearly a hundred startups, and found that companies with strong traction almost always passed 40 of every 100 very disappointed answers.
What is the Sean Ellis test?
It is the same survey, named after its author. It asks one question, how would you feel if you could no longer use this product, and compares the share of very disappointed answers with a bar of 40 of every 100. Ellis recommends asking only people who have experienced the core of the product, used it at least twice and used it in the last two weeks.
How many responses does a product market fit survey need?
Around 40 qualified answers give a directional result; that is the number Superhuman's founder gives, and Learning Loop says 40 to 50. Qualified means the respondent has experienced the core of the product, used it at least twice and used it in the last two weeks. More answers help when you want to read the result by segment, because each segment needs enough answers of its own to compare.
What should you do if the score is below the bar?
Split it before you judge it. Group the answers by customer type and look for a segment that already clears the bar. Study what those customers name as the main benefit, build onboarding and campaigns around it, and ask the somewhat disappointed customers who value that same benefit what holds them back. Superhuman went from 22 to 58 out of 100 that way over three quarters.
Splitting your survey answers by segment and setting them next to who actually stays is part of what The Activation Audit maps. Five business days, $500, and the map stays with you whether or not you hire anyone next.
Your store, five days.
$500. Zero commitment. Yours either way.