
Retention curve: the month it goes flat
A retention curve shows, for one cohort, the share still paying each month. What matters is the month it goes flat, and what that floor is worth.

A retention curve plots, for one signup cohort, the share still paying in each month after it started. Every curve drops early. The line that matters is the month it goes flat: that floor is the product's real audience, and what those customers did in their first weeks is the best answer to what makes people stay.
A single monthly retention rate cannot show that. It blends cohorts of different ages into one number, so a product whose curves level off and a product whose curves never stop sliding can put the same figure on a board slide. Only the shape says which one you run, and moving the floor is worth more than any launch-week spike.
A retention curve plots, for one cohort, the share still paying in each month after it started. Almost every curve drops early. What matters is whether it goes flat: the flat month marks the floor of customers who keep paying, and the value of that floor, not one blended monthly rate, says whether the product holds.
Key takeaways
- A single monthly retention rate hides whether the underlying curve has flattened or is still sliding toward zero.
- The base of the curve is the cohort that started paying, not whoever is still around.
- On the example product, a cohort of 44 keeps 34 by month six and 16 or 17 by month 24: the curve never goes flat.
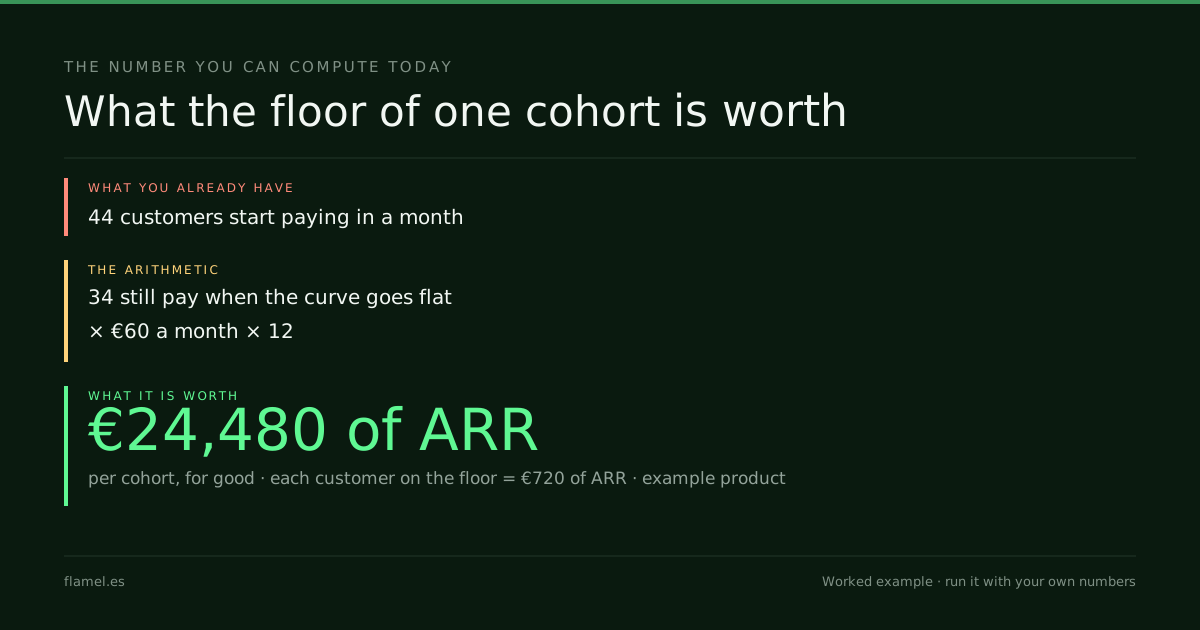
- If it went flat at month six, each cohort would keep €24,480 of ARR for good; each customer on the floor is €720 of ARR.
- Plot the last twelve monthly cohorts by month, mark the month the line stops dropping, and price the floor.
What a retention curve actually plots
A retention curve is the month-by-month record of one cohort, not an average across cohorts measured at different ages. Start with the customers who began paying in month 0. For every month after, count how many of that same group still pay, divide by the original cohort size, and plot the result.
Month N retention = customers from the cohort still paying in month N ÷ customers who started paying in month 0 × 100The line drops fastest in the first months for almost every product. What separates one product from another is what happens after: the curve either flattens into a floor of customers who keep paying, or it keeps decaying toward zero. Amplitude's 7% retention rule reports that seven-day activation is the strongest predictor of three-month retention across the companies in its 2025 benchmark. What a cohort does in its first week shows up in the curve months later.

One cohort, two retention curves
Take the product this blog's SaaS posts use for their arithmetic: 1,100 paying customers at €60 a month, 220 signups a month, 44 of whom start paying, and a loss of 4 of every 100 payers each month. Marketing adds 44 customers a month and the product loses 44, so the base sits at 1,100 and does not grow.
Follow one month's cohort of 44 on that curve:
- Month 0: 44 paying
- Month 3: about 39
- Month 6: about 34
- Month 12: about 27
- Month 24: 16 or 17
That curve never goes flat. Each cohort slides toward zero, which is exactly why the base stays flat: every month's new customers only replace the ones the older cohorts lose. Churnkey's cohort method uses the base this curve uses: customers still engaged divided by the original number in the cohort, not by whoever is left. Measured that way, a sliding curve cannot hide behind a stable-looking monthly rate.
If the monthly formula itself needs unpacking first, the customer retention rate formula covers it; this post is about the shape behind it. SaaS churn rate reads the same losses from the other side, and a product-led growth motion depends on the floor before it can scale spend against it.
Now suppose the curve went flat at month six, with 34 of the 44 still paying. Nothing about acquisition changes. What changes is what the first weeks taught those 34 to keep doing, and that is the question a flat curve lets a team answer: the customers on the floor did something the other ten did not.
What the floor is worth
Floor value = paying cohort × share still paying at the flat month × ARPU × 12On the example product, a floor at month six keeps 34 customers × €60 × 12 = €24,480 of ARR per cohort, for good, instead of sliding to zero. Two years in, the sliding curve keeps 16 or 17 of the same 44, so the floor is worth about 18 more customers, roughly €12,960 of ARR, per cohort. Every customer added to the floor is €720 of ARR per cohort, and a new cohort arrives every month.
What to do by Monday: pull the last twelve monthly cohorts, plot the share of each still paying month by month against the number that started paying, and mark the month the line stops dropping by more than a point or two. If no month qualifies, the curve has not gone flat yet, and that is the finding. If one does, multiply the customers on the floor by ARPU and by 12: that is what the floor is worth per cohort, and the number to move.
Work through this with your own numbers
You are a SaaS operator reviewing retention data for your own product. Here are my inputs: [customers who started paying in one monthly cohort], how many of them still pay at [month 1], [month 3], [month 6] and [month 12], my [monthly ARPU], and my current blended monthly retention rate of [X]%. Plot these as a month-by-month retention curve starting at 100% in month 0, with the original cohort as the base. Identify the first month where the drop from the month before falls below two points: that is the flat month. If there is none, tell me the curve has not gone flat yet. Report the share still paying at that month and the floor value: customers on the floor × ARPU × 12. Compare the curve with my blended monthly rate and tell me whether the blended rate is overstating the health of this cohort. Then tell me what one more customer on the floor is worth in ARR per cohort and across twelve monthly cohorts.FAQ
What is a retention curve?
A retention curve plots the share of one cohort still paying in each month after it started, rather than one blended rate across the cohort's whole life. It starts at 100% in month 0 and typically drops fast in the first months, then either flattens at a floor or keeps decaying toward zero. The shape of the line, not any single point on it, shows whether a product holds the customers it signs up.
Why can two products report the same retention rate but have different curves?
A monthly retention rate is measured against whoever is still paying that month, so it can look identical for a cohort that flattened early at a low percentage and one still sliding toward zero at a higher starting percentage. Both can show a stable-looking month-over-month rate from that point forward while describing opposite trajectories for the original cohort. Only the month-by-month curve, plotted against the original cohort size, separates the two.
What does a flattening retention curve mean?
A flattening curve means the drop between consecutive months has shrunk to a point or two, and the share of the cohort still paying has stabilized at a floor. That floor is the number that predicts long-term retention, because it describes customers who kept paying rather than customers who have not cancelled yet. A curve that never flattens means the cohort is still leaving, even if the monthly rate looks stable.
How is a retention curve different from a churn rate?
A churn rate is usually one number for one period: the share of a base that left. A retention curve is the same underlying behavior plotted month by month against a fixed original cohort, which shows when and where the losses happen instead of only how many. A single churn rate can be flattered by measuring against a shrinking active base; the curve exposes that because it keeps the original cohort size as the denominator throughout.
What cohort size do you need to read a retention curve?
There is no fixed minimum, but small cohorts swing from month to month by chance. On the example product, a monthly cohort is 44 paying customers, so one cancellation moves the curve by more than two points. At that size, combine three consecutive monthly cohorts, about 130 customers, before reading the shape.
If you don't know the month your own curve goes flat, that's what the Activation Audit maps: five business days, $500, and the map is yours whether or not you hire us.
Your store, five days.
$500. Zero commitment. Yours either way.