
Black Friday inventory planning: stock the peak
Black Friday inventory planning from three numbers: peak sessions, conversion and units per order, with the cost of buying short worked out.

Black Friday inventory planning usually starts from last November's units and a feeling about this year. That guess hides which number moved. A forecast built from the store's own data is a short chain: peak sessions times conversion gives orders, and orders times units per order gives units. Each link can be checked on its own, and the answer is a range, not one figure.
The two ways to miss do not cost the same. A unit short loses the margin of an order that never happens. A unit too many holds cash until it sells. So where the buy sits inside the range is a decision, taken on purpose rather than by eye.
The sum below runs on the store this blog uses throughout, in the same peak month as the post on page speed. It ends on the number to compute before the purchase order goes out.
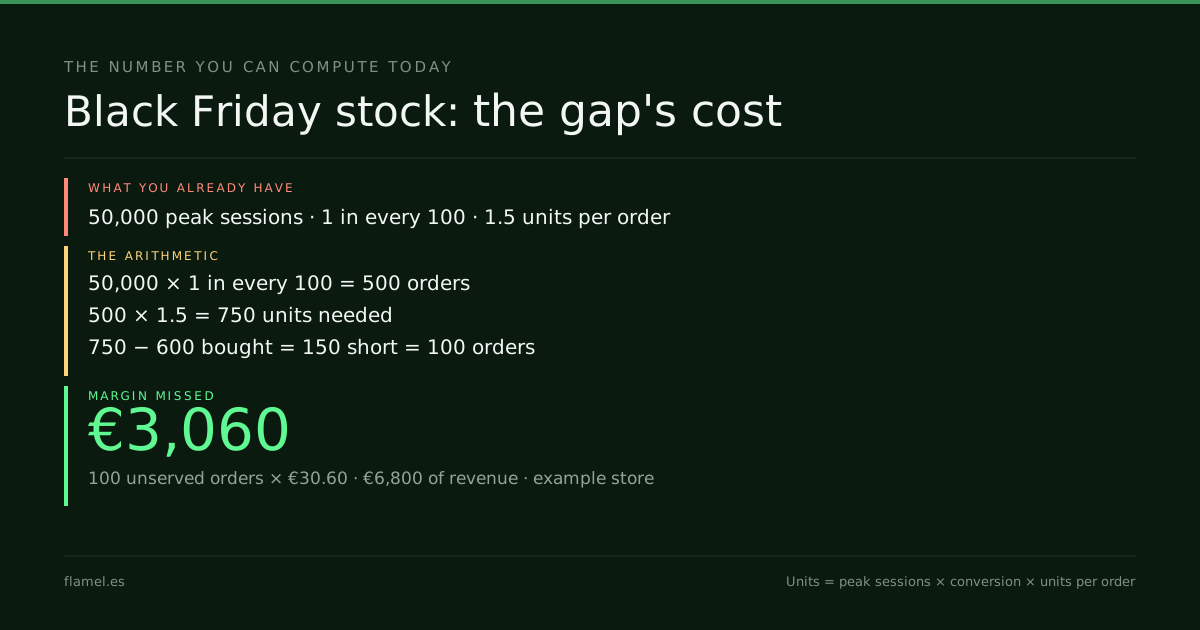
Black Friday inventory planning starts from a forecast: peak sessions × conversion = orders, and orders × units per order = units. On 50,000 peak sessions converting at 1 in every 100, with 1.5 units per order, that is 500 orders and 750 units. Buying 600 by eye leaves 100 orders unserved: €3,060 of margin.
Key takeaways
- Black Friday inventory planning by eye hides which of three numbers moved: peak sessions, conversion or units per order.
- Units = peak sessions × conversion × units per order; each link has its own source and its own owner.
- On 50,000 peak sessions at 1 in every 100 and 1.5 units per order, the store needs 750 units, not 600.
- A unit short loses margin for good; a unit too many holds cash that comes back as it sells.
- Write last year's peak as three links, change only what this year's plan moves, and buy inside the range.
Why Black Friday inventory planning starts with demand
Most stores plan the peak from what sold last year. Last November's units plus a cushion become this November's purchase order. It feels prudent. It is one number standing in for three.
Shopify's guide to inventory forecasting defines it as “the process of predicting your future stock needs using historical sales data.” History is the right start. The trap is reading it as one block. Last year's units mix the traffic the store had, how much of it converted and how much each order carried. If any of the three changes this year, the old total is wrong, and it does not say why.
There is a second trap. Last year's units count what sold, not what was asked for. A product that sold out on Saturday never recorded the orders it turned away on Sunday. The sell-through rate of that drop read as a win, and the demand it missed is not in the history. A forecast built on it inherits the gap.
Ecommerce demand forecasting in three links
Ecommerce demand forecasting for a peak can be written as a chain the store already has the data for:
Orders = peak sessions × conversion rate
Units  = orders × units per order
Each link has its own source and its own owner.
- Peak sessions. The campaign plan and last year's peak month, not the average month. Paid media, email and the Black Friday calendar decide most of it.
- Conversion rate. The rate the store had in its last peak, read the way the ecommerce conversion rate post describes: orders over sessions, for the same pages and devices. A slower site or a deeper discount moves it.
- Units per order. From the order export: units shipped divided by orders. Bundles, multi-buy offers and gift buying push it up in November.
The point of splitting it is the argument it allows. Marketing defends the sessions. The site's numbers defend the conversion. The order data defends the units. When the forecast misses, the store can see which link failed and fix that one next year.

The worked example: 50,000 sessions
Take the store this blog uses throughout: a €68 average order, a 45 percent gross margin and 300,000 sessions a year, converting 1 in every 100. Its peak month is declared at 50,000 sessions, twice its 25,000 average, the same peak used in the post on page speed and conversion. Units per order are declared at 1.5. It is an example, not a client's numbers.
Peak sessions:     50,000
Orders:            50,000 × 1 in every 100 = 500
Units:             500 × 1.5 = 750
Now the founder buys by eye: 600 units, last November plus a cushion. The forecast says 750.
Units short:       750 − 600 = 150
Orders unserved:   150 ÷ 1.5 = 100
Revenue missed:    100 × €68 = €6,800
Margin missed:     100 × €30.60 = €3,060
The €30.60 is the margin on a full-price order, the same figure behind the Black Friday discount strategy post. If the peak runs at 20 percent off, each order keeps €17.00, so the 100 unserved orders cost €1,700 of margin instead. The revenue the store did not take is €5,440 at that price.
That sum assumes every unserved shopper leaves. Some will wait for the restock or pick a similar product. Most stores cannot tell how many, because nobody counts the visitors who found the product sold out. A back-in-stock signup is the cheapest way to start counting.
Which link of the chain a store reads wrong, and where the peak's traffic loses orders before stock even matters, is what The Conversion Audit maps in five business days, for $500.
A range, not one number
A forecast with one figure hides how unsure it is. Conversion is the link that moves most from one peak to the next, so run it at three levels:
| Conversion | Orders | Units |
|---|---|---|
| 0.8 in every 100 | 400 | 600 |
| 1.0 in every 100 | 500 | 750 |
| 1.2 in every 100 | 600 | 900 |
The founder's 600 units are not a wild guess. They are the bottom of the range, bought as if the low case were certain.
The range also has to carry the promotion's own plan. A discount is meant to lift orders. If the plan counts on a markdown to bring more orders than a normal peak, the stock has to be there to serve them. A discount that wins orders the store cannot ship gives up margin on every order it does serve, and never collects the extra volume that was meant to pay for it.
Short or long: the two costs
Shopify's guide names both costs. On running out: “Any time you have a popular item out of stock, known as a stockout, you are losing revenue.” On the other side: “Every unnecessary product costs money to store.”
They are not the same size, and they do not last the same time. On the example store:
- Short. Each order not served is €30.60 of margin at full price, gone. The shopper may buy elsewhere, and the season does not come back.
- Long. Buy 900 units and sell 600, and 300 are left: 200 orders' worth of goods at €37.40 each, €7,480 of cash sitting in the warehouse. That cash is not lost. It comes back as the stock sells after the peak.
How fast it comes back is the real question. Leftover stock still earns margin at any discount shallower than 45 percent off, the point where this store's price meets its cost. What it costs meanwhile is storage, and the weeks the cash is not working elsewhere.
So the buy is placed inside the range on purpose. If last year's leftovers sold through in a few weeks at full price, the top of the range is cheap insurance. If they needed a deep markdown in January, a buy closer to the middle, with a reorder planned, is safer. Shopify calls the deliberate cushion safety stock: “the extra inventory required to mitigate the risk of stockout.” The cushion is a choice with a price, not a feeling.
Lead time sets the last limit. If the supplier needs six weeks and the peak lasts one, there is no reorder during Black Friday. The whole range has to be decided before the purchase order goes out.
The Black Friday inventory planning number for your store
Four inputs: peak sessions from the campaign plan, the conversion rate of the last peak, units per order from the order export, and margin per order.
Units needed    = peak sessions × conversion × units per order
Cost of the gap = (units needed − units bought) ÷ units per order × margin per order
On the example store: 50,000 × 1 in every 100 × 1.5 = 750 units. Buying 600 leaves 100 orders unserved, €3,060 of margin.
What to do by Monday: pull last year's peak month and write its three links separately: sessions, conversion and units per order. Change only the link this year's plan actually moves. Run the chain at the lowest and highest conversion of the last two peaks, and place the buy inside that range with last year's leftover sell-through in mind.
Work through this with your own numbers
You are planning Black Friday inventory for an online store. Inputs: [peak-month sessions from the campaign plan], [conversion rate in the last peak month], [units per order from the order export], [average order value], [gross margin per order] and [units I plan to buy]. Calculate orders as sessions × conversion and units as orders × units per order. Repeat at the lowest and highest conversion of the last two peaks and show the three cases in a table. For each case, calculate the orders left unserved if I buy my planned units, with their cost in revenue and margin, or the leftover units and the cash they hold at cost. Ask me how fast last year's leftovers sold after the peak before recommending where in the range to buy. Do not assume every unserved shopper is lost: list the data that would show how many waited or substituted.FAQ
How do you forecast inventory for Black Friday?
Split the forecast into three links: peak sessions from the campaign plan, the conversion rate of the last peak, and units per order from the order export. Orders = sessions × conversion, and units = orders × units per order. On 50,000 sessions at 1 in every 100 and 1.5 units per order, that is 750 units.
How much extra stock should you hold for Black Friday?
Run the forecast at a low and a high conversion rate and buy inside that range. On the example store, conversion from 0.8 to 1.2 in every 100 gives 600 to 900 units. Lean to the top when leftovers sell through quickly at full price, and closer to the middle when they need a deep markdown.
What does a stockout cost an online store?
Each unserved order costs its revenue and its margin. On a €68 order with a 45 percent gross margin, that is €30.60 of margin per order at full price. Being short 100 orders costs €6,800 of revenue and €3,060 of margin, before counting shoppers who never come back.
What is the difference between demand forecasting and inventory planning?
Demand forecasting estimates how many units shoppers will want. Inventory planning decides how many to buy, when, and with what cushion, given lead times, cash and what leftovers are worth after the peak. The forecast gives a range; the plan places the buy inside it.
Before the purchase order goes out, know which link of the chain the store reads wrong. The Conversion Audit maps where the store loses orders and what to fix first: five business days, $500, and the map stays with you whether or not you hire anyone.
Your store, five days.
$500. Zero commitment. Yours either way.