Page speed conversion rate: the second that costs
Page speed conversion rate, priced: what one second of load time is worth on the page a campaign sends traffic to, worked on a 50,000-session peak month.
Page speed conversion rate is the link between how fast a page loads and how many of its visitors buy. Renault measured it on more than 10 million landing-page visits: one second faster on Largest Contentful Paint came with 13 percent more conversions. On a store converting 1.0% of a 50,000-session peak month, that second is 65 orders, or €4,420.
A campaign buys sessions. The page it lands on decides how many of them get a fair chance to buy, and the people who planned the campaign have rarely opened that page on a phone, on a mobile network. In an average month the slow second hides inside the conversion rate. In the peak, every session the campaign pays for runs into it.
So the number to know before the peak is what one second is worth on the page the campaign points to. It comes from real visitors, not from a lab score, and it fits on one line.
Page speed conversion rate links load time to how many visitors buy. Renault found one second faster on Largest Contentful Paint came with 13 percent more conversions. On a store converting 1.0% of a 50,000-session peak month at a €68 average order, that second is 65 orders, or €4,420.
Key takeaways
- Page speed conversion rate is how load time changes the share of visitors who buy; it is measured on the page the campaign links to.
- Renault saw 13 percent more conversions per second of Largest Contentful Paint across more than 10 million landing-page visits.
- Google's threshold is an LCP of 2.5 seconds or less at the 75th percentile, read on field data for mobile.
- On a store converting 1.0% of a 50,000-session peak month at €68, one second is 65 orders: €4,420.
- Price one second on the page that will take the most peak traffic, using its own field LCP, before the campaign starts.
Page speed conversion rate: the field evidence
The clearest per-second figure comes from Renault, published as a case study on web.dev, Google's site for web developers. The team looked at more than 10 million visits in 33 countries, from December 2020 to March 2021, measured on landing pages only. A conversion there is a completed lead form. Running linear regressions over that data, Renault found that a 1 second LCP improvement can lead to a 14-point drop in bounce rate and 13 percent more conversions. Its conclusion: it is worth optimizing the site until LCP gets below 1 second.
Retail points the same way. A study commissioned by Google and run by 55 and Deloitte followed 37 European and American brand sites and more than 30 million mobile sessions at the end of 2019. A 0.1-second improvement lifted conversion rates by 8.4% on retail sites, and retail shoppers spent 9.2% more. There was a condition: the gains only showed when every page across the journey improved by a tenth of a second on four speed metrics.
The two studies do not draw one straight line. Deloitte's tenth of a second had to land on four metrics across the whole journey. Renault's second is one metric, on the landing page. Neither is a store's own number. They set the order of magnitude, and they say the effect is large enough to price.
Which second to measure
The second that matters is Largest Contentful Paint: the render time of the largest image, text block or video visible in the viewport. Google's guidance is to keep it at 2.5 seconds or less. Above 4.0 seconds it counts as poor. The threshold is read at the 75th percentile of page loads, segmented across mobile and desktop.
That percentile matters for a campaign. A page at 2.5 seconds on the 75th percentile still leaves a quarter of its visits waiting longer. For a campaign whose clicks come from phones, the mobile figure is the one that counts.
The second also has to come from the right source. PageSpeed Insights shows two kinds of data. Lab data is a simulated load of a page on a single device and a fixed set of network conditions. It is useful for debugging. Field data comes from the Chrome User Experience Report: real visitors over the previous 28 days. A lab score can look fine while real phones wait. The price of the second is set by the field.
And it has to come from the right page. A campaign rarely lands on the home page. It lands on a collection, a product page or a page built for the promotion, sometimes the newest page on the site.

The worked example: a 50,000-session peak
Take the store used throughout this blog: 300,000 sessions a year, 25,000 a month on average, an average order of €68 and a conversion rate of 1.0%. That is 3,000 orders a year. Declare a peak month at twice the average: 50,000 sessions.
Apply Renault's figure as the starting estimate, one second faster on LCP and 13 percent more conversions:
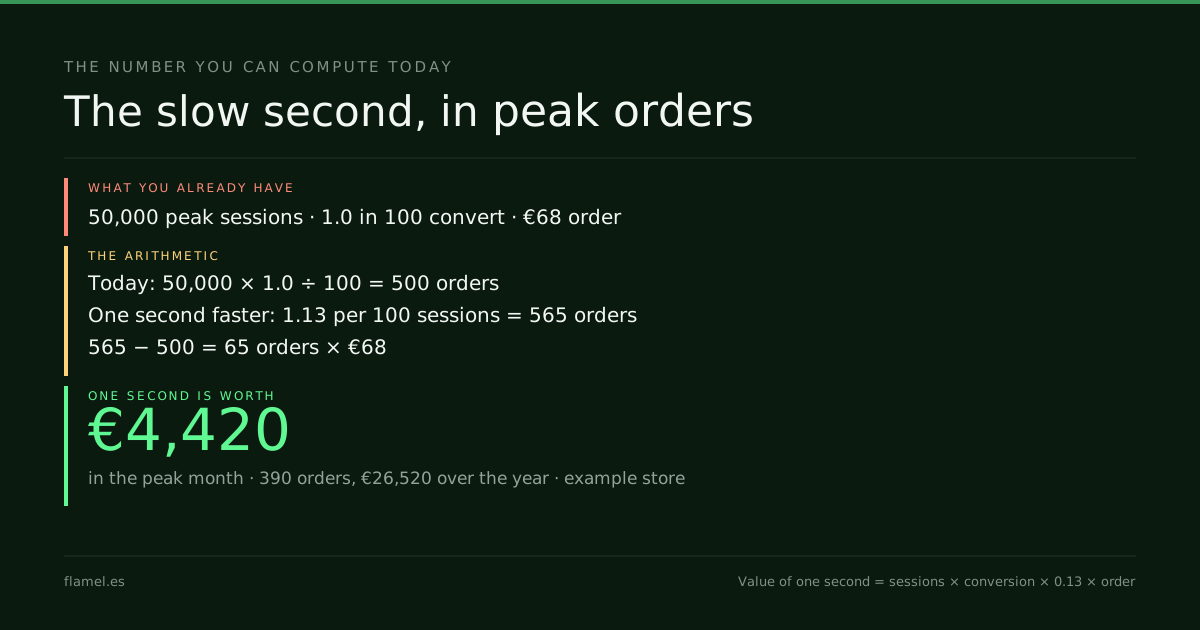
Peak month today:      50,000 sessions × 1.0 per 100 = 500 orders  → €34,000
One second faster:     1.0 × 1.13 = 1.13 orders per 100 sessions
                       50,000 × 1.13 ÷ 100 = 565 orders           → €38,420
Value of the second:   65 orders × €68 = €4,420 in the peak month
Over the full year the same second is worth 390 orders and €26,520. That is in line with the value of a tenth of a point of conversion on this store, €20,400 a year: a second faster moves the rate by 0.13 points. At this store's margin of 45 euros in every 100, the peak month's €4,420 leaves about €1,990 of gross margin.
The comparison with the promotion is direct. At 20 off, a Black Friday discount needs 1.8 times the orders to earn the same margin. The 65 orders from a faster page arrive at full price.
Why the peak raises the price
The value of a second is proportional to the sessions that meet it. The peak month carries a sixth of this store's yearly sessions, so it carries a sixth of the second's yearly value: €4,420 of €26,520. A second the store lives with in March costs twice as much in a month with twice the traffic.
Three things make it worse just before the peak:
- Traffic concentrates. Campaigns send most of their sessions to a handful of landing pages, so one slow template carries much of the month.
- Pages get heavier. Countdown timers, new banners, review widgets and fresh tracking tags tend to go live right before the peak. Renault's own fix list included a smaller Google Tag Manager container, so third-party scripts load only when needed.
- The traffic is already paid for. A slow page does not lower the media bill. It lowers what each euro of it returns.
That is why speed belongs in the same review as the four places a store leaks revenue, and why it has to be read on the campaign's pages before the traffic arrives.
Page speed conversion rate on your own page
Value of one second = peak sessions × conversion rate × lift per second × average orderUse 0.13 as the lift per second until the store has its own reading. If the site sends load times to its analytics, compare conversion between fast and slow sessions on the same page, and replace the 0.13 with that gap.
On the example store: 50,000 × 1.0 ÷ 100 × 0.13 × €68 = €4,420 for the peak month.
- List the URLs the peak campaigns will link to.
- Open each one in PageSpeed Insights and read the field LCP on mobile.
- Mark every page above 2.5 seconds, then price one second on each with the formula.
What to do by Monday: run step 2 on the single page that will take the most campaign traffic, and write its field LCP next to the euros one second is worth there.
Work through this with your own numbers
You are reviewing an online store before its peak season. Inputs: [the landing page URLs my peak campaigns will link to], [the field LCP on mobile for each page, from PageSpeed Insights], [sessions each page is expected to receive in the peak month], [my conversion rate] and [my average order value]. For each page, calculate the value of one second faster as sessions × conversion rate × 0.13 × average order value, using 0.13 as the lift per second unless I give you [my own conversion gap between fast and slow sessions]. Flag every page with a field LCP above 2.5 seconds. Rank the pages by the euros one second is worth, and for the top one list the three heaviest elements most likely to delay its Largest Contentful Paint. Do not recommend a fix without naming the measurement that would confirm it worked.FAQ
How much does page speed affect conversion rate?
On Renault's landing pages, one second faster on Largest Contentful Paint came with 13 percent more conversions. A Deloitte study for Google found a 0.1-second gain across the whole journey lifted retail conversion 8.4%. On a store converting 1.0% of 50,000 sessions at €68, one second is worth 65 orders, or €4,420.
What is a good page load time for ecommerce?
Google's guidance is a Largest Contentful Paint of 2.5 seconds or less, read at the 75th percentile of page loads, separately for mobile and desktop. Above 4.0 seconds counts as poor. Renault's data suggests the gains keep coming until LCP drops below one second.
How do you measure page speed for a landing page?
Open the exact URL the campaign links to in PageSpeed Insights and read the field data on mobile. Field data comes from real Chrome visitors over the previous 28 days. Lab data is a simulated load on one device and is meant for debugging, not for pricing the second.
How do you calculate the revenue lost to a slow page?
Multiply the sessions the page will receive by its conversion rate, by the lift per second, and by the average order. With 50,000 sessions, a 1.0% conversion rate, a lift of 0.13 per second and a €68 order, one second is worth €4,420 in that month.
Finding the second that costs, on the pages a campaign is about to send traffic to, is part of what the Conversion Audit maps. Five business days, $500, and the map stays with you whether or not you hire anyone next.
Your store, five days.
$500. Zero commitment. Yours either way.