
Sell through rate: what a sold-out drop didn't count
Sell through rate is units sold divided by units available. On a drop that sells out, it hides the demand turned away. How to count that, in euros.

Sell through rate is units sold divided by units available, over a set window. A 200-unit drop that sells 150 units in its first week has a sell-through of 75 of every 100. Sell all 200 and it reads 100, the top of the scale, which is exactly where the number stops seeing anything.
For a brand that lives on launches, that ceiling is the problem. A drop that sells out in hours gets celebrated, and nobody counts the people who arrived after the last unit was gone. That demand is real, it leaves a trace, and it is the number that should size and date the next drop.
Sell through rate is the share of available units sold in a period: units sold divided by units available, times 100. Shopify sets 80 of every 100 units as the benchmark for a launch window. A drop that reads 100 has no room left to show demand; count back-in-stock signups to see what it missed.
Key takeaways
- Sell-through rate is units sold divided by units available in the drop window, times 100.
- Shopify sets the benchmark for a launch window at 80 of every 100 units or more.
- A sold-out drop reads 100 and cannot show the demand it turned away.
- On the worked drop, 300 back-in-stock signups at 1 in 5 are 60 orders: €4,080 uncounted.
- Size the next drop with units sold plus signups times their conversion.
The sell through rate formula, in one line
Sell-through rate = units sold ÷ units available × 100Shopify defines it as the percentage of inventory sold to customers in a given period, and writes it as total units sold over stock on hand. Its own report is more precise about the denominator: units sold divided by units sold plus units still in stock on the last day of the period, so restocks received during the window are counted.
Two choices make the number comparable from drop to drop:
- The window. For a drop, the window is the drop itself: from the moment it opens until the last unit goes or the launch week ends. A monthly figure blends the launch with the quiet weeks around it.
- The denominator. Units available, including restocks inside the window. Divide by the first batch only and a restock inflates the rate.
A good sell through rate: 80 of 100
Shopify puts the benchmark at 80 of every 100 units or more and, for short-life or seasonal drops, above 80 within the launch window. For evergreen products it calls 40 to 60 per month or quarter acceptable.
Read against that bar, a drop at 75 needs a look and a drop at 100 passes every test there is. That second case is where the trouble starts.
Why a sold-out drop is a blind spot
The rate divides by what was available. Once everything is gone, it is capped at 100 and cannot tell apart two different drops: one that sold its last unit late on day seven, and one that ran out in forty minutes with hundreds of people still refreshing the product page. Both read 100. The second one turned demand away, and the formula has no place to put it.
The trace of that demand is the back-in-stock signup. A shopper who leaves an email on a sold-out page has picked the product, often the size, and asked to be told. An agency director writing on Klaviyo's blog calls the waitlist signup one of the clearest intent signals a brand gets.

Unserved demand: the second number
Unserved demand = back-in-stock signups × their conversion rate × average order valueThe rate to use is the one your back-in-stock email already measures on a restock, and it is a floor: by the time stock returns, part of that demand has bought elsewhere or moved on. For one brand in that same Klaviyo piece, the back-in-stock email converted 7.9 of every 100 recipients and the text message 8.5. One client, not a benchmark: the number that counts is your own.
A worked drop: the €4,080 gap
Take the store used throughout this blog: an average order of €68, 300,000 sessions a year and a conversion rate of 1.0%, which is 3,000 orders a year. It releases a 200-unit drop. All 200 units go on the first evening: €13,600, and a sell-through of 100.
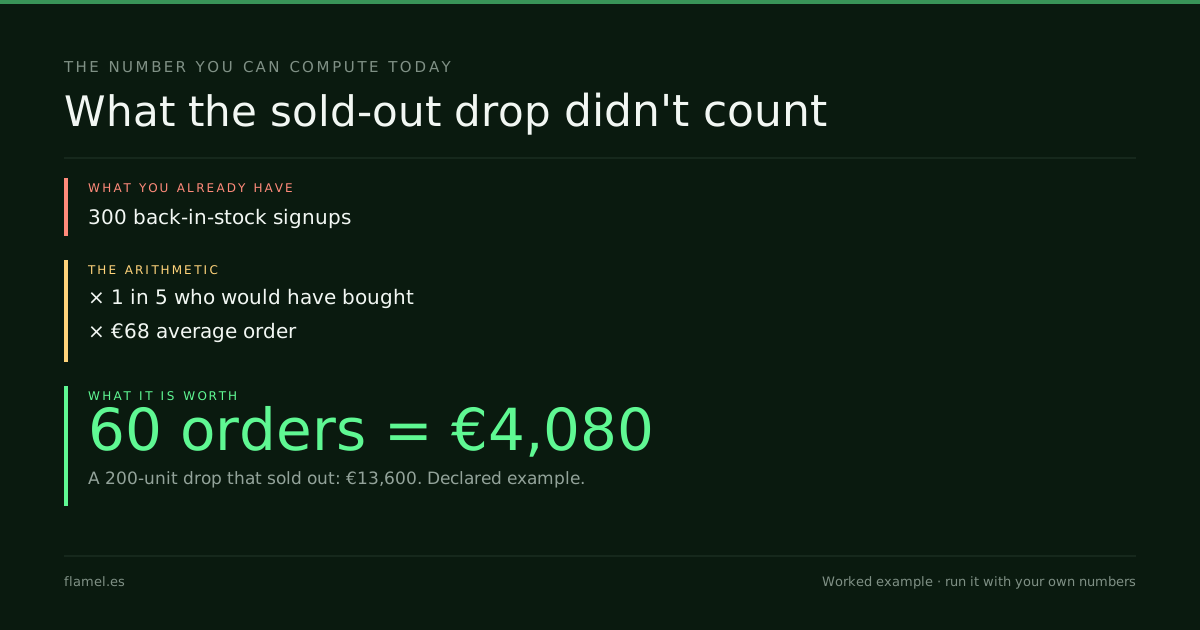
The sold-out page collects 300 back-in-stock signups. Two readings, both declared as examples:
- At the floor, 8 in 100, close to the email figure above: 24 orders, or €1,632.
- If 1 in 5 would have bought at launch: 60 orders, or €4,080 the drop never counted.
Sixty orders is 2 of every 100 orders this store takes in a year, turned away in one evening. These shoppers had already arrived and chosen, so their customer acquisition cost was already paid.
What the uncounted number decides
The size of the next drop. The drop that would have met demand on this store was about 260 units, not 200: the units sold plus the orders the signups stand for.
The date of the next one. Signups that keep arriving for days after the sellout say the demand is still there for a restock. Signups that stop the same night say the next release can wait for its own launch. The sell-through rate cannot say either thing, because it stopped counting at 100.
It belongs in the same review as the four places a store leaks revenue, as a fifth line: the orders a store never had the chance to take.
The number to take to your own drop
- Divide units sold by units available inside the drop window. That is the sell-through rate.
- If it reads 100, count the back-in-stock signups for that product.
- Multiply them by the conversion rate your last back-in-stock email measured, then by your average order value.
The result is what the drop did not count, in euros. Signups times that rate, in units, is how much bigger the next one should be.
Work through this with your own numbers
You run an online store that sells in drops. Your last drop had [units available] units at an average order value of [average order value], and [units sold] sold in [time it took to sell out]. The sold-out product page collected [back-in-stock signups] signups, and your last back-in-stock email converted [conversion of that email] of its recipients. Calculate the sell-through rate as units sold divided by units available; the unserved demand in orders as signups times that conversion, and in revenue at your average order value; and the drop size that would have met demand. Then look at when the signups arrived, using [signups by day after the sellout], and tell me whether that points to a restock soon or to holding the demand for the next launch.FAQ
What is a good sell through rate?
Shopify sets the benchmark at 80 of every 100 units or more, and above 80 within the launch window for short-life or seasonal drops. For evergreen products, 40 to 60 per month or quarter is acceptable. The comparison that decides anything is the same brand's previous drops, measured over the same window.
How do you calculate sell-through rate?
Divide units sold by units available in the period and multiply by 100. Shopify's report uses units sold plus units still in stock at the end of the period as the denominator, so any restock received during the window is counted. For a drop, use the drop itself as the window.
Is a sell-through rate of 100 a good result?
It means every unit sold, and it also means the rate can no longer see demand. A drop that ran out in an hour and one that ran out on its last day both read 100. Count the back-in-stock signups to see how much demand the drop turned away.
How do you measure demand after a product sells out?
Multiply back-in-stock signups by the conversion rate your back-in-stock email measures on a restock, then by your average order value. That rate is a floor, because some of the demand buys elsewhere before stock returns. The result in units also tells you how much larger the next drop could be.
Counting what a sold-out drop turned away, next to the four places a store leaks revenue, is part of what the Conversion Audit maps. Five business days, $500, and the map stays with you whether or not you hire anyone next.
Your store, five days.
$500. Zero commitment. Yours either way.