
Promotion incrementality: the orders it didn't create
Incrementality is what a promotion caused beyond the orders coming anyway. Count it with a baseline and the dip after, and see what the margin really did.

Incrementality is the part of a result that a campaign or a promotion actually caused: the orders that would not have happened without it. For a promotion, it is the promotion's orders minus the baseline, what the week would have sold anyway, minus the dip after it, the orders pulled forward from the weeks that follow.
A promotion week almost always looks like a win. Orders double, the chart spikes, and the team moves on to the next one. The baseline and the dip are the two numbers that decide whether it paid. Both have to be written down before the first discount code goes out.
The sum below runs on the store this blog uses throughout. It ends on the number to fix before the next promotion: how many orders it has to take to pay for itself once the dip is counted.
Incrementality is what a promotion caused beyond the orders that were coming anyway. Incremental orders = promotion orders − baseline − post-promotion dip. On a store selling 58 orders a week, a 20-off week with 120 orders creates only 36 incremental ones and loses €530 of margin over three weeks.
Key takeaways
- Incrementality is the share of a result a promotion caused: its orders minus the baseline, minus the dip in the weeks after.
- Fix the baseline before the promotion, from normal weeks, the same weeks last year or a holdout that never sees the offer.
- On the example store, a 20-off week with 120 orders creates 36 incremental orders: 30 of every 100.
- The week view shows €265 more margin; over three weeks, with the dip counted, the same promotion loses €530.
- Before the next promotion, write the orders it needs: (baseline + dip) × full margin ÷ discounted margin, about 152 on the example.
What incrementality actually counts
Every result has two parts. One part would have happened anyway. The other happened because of the campaign. Incrementality is the second part, and it is the only one the campaign can claim.
Google describes its own measurement tool in those terms. Its help page on Conversion Lift calls incrementality experiments “the way to measure the causal impact of ads.” The method is a comparison between “People who see your ads (treatment group)” and “People who don't see your ads (control group)”. The difference between the two groups is the lift.
A promotion works the same way, with one more piece. A discount does not only bring new orders and give away margin on the orders that were coming. It also moves orders in time. A customer who planned to buy in two weeks buys now, at the lower price, and then does not buy in two weeks. So a promotion's orders split three ways:
Promotion orders = baseline + pulled forward + incremental

baseline       = what the week would have sold at full price
pulled forward = orders taken from the weeks after (the dip)
incremental    = orders the promotion actually created
The baseline: what the week would have sold
The baseline is the hardest number, because it never happens. Once the promotion runs, nobody can see the week without it. That is why it is written down before the first code goes out, from one of three places:
- The weeks before. The average of the last four to eight normal weeks, with no other promotion in them. Simple, and good enough for a store with steady demand.
- The same weeks last year. Last year's orders for those weeks, scaled by how much the store has grown since. Better before a seasonal peak, when the weeks before are not normal.
- A holdout group. A share of customers who never see the offer. Their orders, scaled to the whole list, are the baseline. It is the only one of the three that measures instead of estimating.
A baseline set after the promotion tends to drift toward whatever makes the promotion look good. Set before, it is a prediction the result can prove wrong.

The promotion incrementality example: one 20-off week
Take the store this blog uses throughout: 300,000 sessions a year, 1 order in every 100, €68 average order. That is 3,000 orders a year, about 58 a week. At 45 of every 100 euros in margin, a full-price order keeps €30.60, the figure in what AOV means. At 20 off, it sells for €54.40 and keeps €17.00, as in Black Friday discount strategy.
Say a seven-day promotion at 20 off takes 120 orders. In the two weeks after it, the store sells 45 orders a week instead of 58. Those two figures are declared for the example, not a client's numbers.
Baseline            58
Dip after           (58 − 45) × 2 weeks = 26
Incremental         120 − 58 − 26 = 36
Incremental share   36 ÷ 120 = 30 of every 100 promotion orders
Now the margin, read two ways:
Week view
  With promotion    120 × €17.00 = €2,040
  Without            58 × €30.60 = €1,775
  Difference                       +€265

Three-week view
  With promotion    €2,040 + 90 × €30.60 = €4,794
  Without           174 × €30.60          = €5,324
  Difference                               −€530
The week view says the promotion paid. It even clears the rule from the discount post: at 20 off, a promotion needs 1.8 times the orders, 105 here, and it took 120. The three-week view says it lost €530, because 26 of its orders were going to arrive at full price two weeks later.
The dip: orders borrowed from later
The dip is easy to miss. Igal Hendel and Aviv Nevo studied it in supermarket scanner data in The Post-Promotion Dip Puzzle. Their starting point: “During a promotion consumers buy more, not only for current consumption, but stockpile for future consumption.” They found the dip in the aggregate data once other promotional activity was accounted for, because that activity “has an opposing dynamic effect that masks the existence of the post-promotion dip.”
An online store knows that masking well. The week after a promotion, a new email goes out, a new collection lands or paid traffic goes up, and the dip disappears into a normal-looking chart. The orders still moved. Nobody counted them.
So the dip window is fixed before the promotion too: how many weeks after it are compared against the baseline, and which other campaigns are kept out of that window, or at least written next to it.
Incrementality testing with a holdout group
A holdout is Google's control group, applied to a promotion. Before the email goes out, a random share of the list is set aside and never gets the code. When the dip window closes, the orders per customer in the holdout are compared with the orders per customer in the group that got the offer, across the promotion and the weeks after it.
Incremental orders = (orders per customer, offer group
                      − orders per customer, holdout)
                     × customers in the offer group
The holdout has the same limit as A/B testing with low traffic: the smaller the difference it has to see, the larger the group it needs. A short list can still hold out part of its past buyers, the group Black Friday early access reaches first, and learn how much of their buying a promotion only moves in time.
Read this way, each promotion becomes an experiment with a hypothesis, a measure and a closing date, the frame in marketing experiments. Read on the week alone, it is a chart.
The incrementality number before the promotion
Incremental orders  = promotion orders − baseline − dip
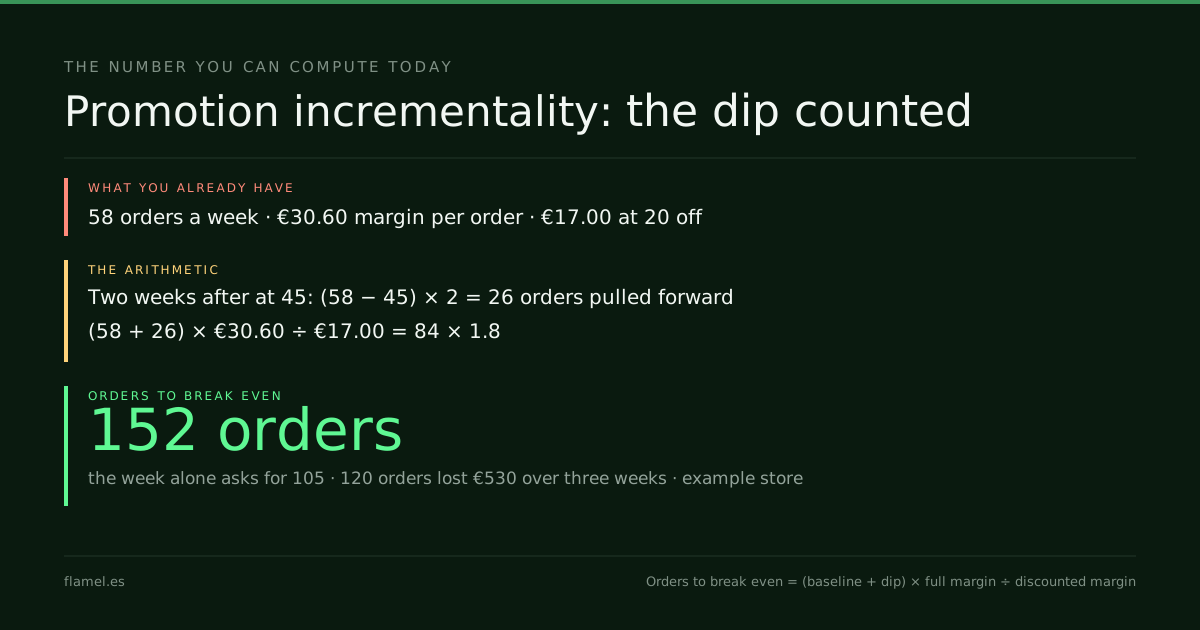
Orders to break even = (baseline + dip) × full margin ÷ discounted margin
On the example store, at 20 off: (58 + 26) × €30.60 ÷ €17.00 = 84 × 1.8 ≈ 152 orders. The week view asked for 105. The promotion took 120: it cleared the first number and missed the second by 32 orders.
What to do by Monday: before the next promotion, write three numbers on one line. The baseline for the week. The dip window, two weeks to start. And the orders the promotion needs: (baseline + dip) × full margin ÷ discounted margin, with the last promotion's dip, or zero the first time, which gives the floor. When the window closes, fill in what happened next to them.
Work through this with your own numbers
You are reviewing a past promotion for an online store, and planning the next one. Inputs: [normal weekly orders before the promotion], [orders during the promotion week], [weekly orders in each of the two weeks after], [average order value], [gross margin per order at full price] and [discount depth]. Set the baseline as the normal weekly orders. Calculate the dip as the baseline minus each week after, summed over the two weeks. Calculate incremental orders as promotion orders minus baseline minus dip, and their share of promotion orders. Compare the margin with and without the promotion over the promotion week alone and over the three weeks together. Then calculate the orders the next promotion needs to break even: (baseline + dip) × full-price margin ÷ discounted margin. Say whether the past promotion paid, and list any other campaign in the dip window that could hide the dip.FAQ
What is incrementality?
Incrementality is the part of a result a campaign or promotion actually caused: the orders, visits or conversions that would not have happened without it. It is measured against a baseline of what would have happened anyway, ideally a control group that never saw the campaign.
How do you measure the incrementality of a promotion?
Subtract the baseline and the dip from the promotion's orders. The baseline is what the week would have sold at full price, set beforehand. The dip is the orders missing in the weeks after, compared with the same baseline. What is left is incremental.
What is incrementality testing?
An experiment that splits an audience into a group that sees the campaign and a group that does not, then compares their results. The difference is the lift. For a promotion, the control is a holdout of customers who never get the code, read across the promotion and the weeks after.
What is a post-promotion dip?
The drop in orders in the weeks after a promotion, caused by customers who bought earlier than planned or stocked up at the lower price. It is often masked by the next email, launch or campaign, so it has to be counted against a baseline fixed in advance.
How many orders does a promotion need to pay for itself?
Baseline plus dip, times the full-price margin, divided by the discounted margin. On a store with 58 orders a week, a 26-order dip and 20 off at 45 in every 100 euros of margin, that is about 152 orders, not the 105 the week alone suggests.
Before the next promotion goes live, know its baseline and where the store loses orders the rest of the year. The Conversion Audit maps it in five business days, for $500, and the map stays with you whether or not you hire anyone.
Your store, five days.
$500. Zero commitment. Yours either way.