
A/B testing with low traffic: test the launch
Every A/B test calculator gives you a sample size. None convert it into months. Here's the math, line by line, on a 25,000-session store.
A/B testing with low traffic produces a result before it produces evidence. Run a test on a store that gets 25,000 sessions a month, and you'll have a winner declared inside three weeks — with a p-value that means almost nothing, because the sample never reached the size the math requires.
Every public calculator will hand you a number: a two-proportion formula sitting behind a clean input form, or your own spreadsheet copying the same math. None of them tell you what that number costs in months, or whether your store can afford to wait that long before the next decision gets made anyway, test or no test.
This post runs the formula on a concrete store, converts the output into months, and gives you the one number that decides whether you test, or test the launch instead.
A/B testing with low traffic means running an experiment before your sessions reach the sample size the math requires, which produces a result without statistical power behind it. Detecting a lift from 1.0% to 1.2% conversion at 95% confidence and 80% power takes about 42,700 sessions per variant — 85,400 total, or roughly 3.4 months at 25,000 sessions a month.
Key takeaways
- A/B testing with low traffic produces a verdict before it produces evidence — the test can finish without ever reaching statistical power.
- Public sample-size calculators return a number but never convert it into a timeline you can act on.
- Detecting a 1.0% to 1.2% lift at 95% confidence and 80% power takes about 42,700 sessions per variant, 85,400 total.
- A store at 25,000 sessions a month needs roughly 3.4 months to finish one test; at 10,000, closer to 8.5.
- Divide 85,400 by your own monthly sessions: if the test outlasts your next season, change one variable per launch and read it against the last launch instead of testing.
A/B testing with low traffic produces false confidence
A test needs enough sessions per variant to tell a real lift apart from noise. Below that threshold, a test can declare a winner that's actually a coin flip wearing a confidence interval. The store doesn't find out until the "winning" variant is rolled out and revenue doesn't move.
The threshold is not a feeling. It's a formula, and it depends on three things you already know: your baseline conversion rate, the smallest lift you care about detecting, and how certain you want to be. Smaller baseline rates and smaller lifts both push the required sample up — fast, and nonlinearly, which is the part most founders underestimate when they eyeball a test plan instead of running the numbers.
This is the uncomfortable part of the argument: many independent stores won't clear that threshold in a window worth waiting for. That's not a reason to stop measuring. It's a reason to measure something else first, with a different method and a different kind of evidence.
The calculators stop at the number
Type "ab test sample size calculator" into a search bar and you'll land on one of a handful of well-built tools from testing platforms and CRO consultancies. All of them return a clean sample size the moment you enter your baseline rate, your minimum detectable effect, and your confidence level.
None of them asks how many sessions you actually get. None tells you that the number it just gave you, divided into your real traffic, is a date on a calendar — and for most stores, that date is further out than the test is worth waiting for.
The same split shows up industry-wide: plenty of published case studies on low-traffic sites open with qualitative fixes, not a test, because the traffic to test them isn't there yet. The calculator and the case study are both right. They're answering different questions, and most stores only ever see the calculator.
Running the math on a 25,000-session store
Take a store with 25,000 sessions a month and a 1.0% conversion rate. The store wants to test a product page change it believes is worth a lift to 1.2%.
The two-proportion sample size formula, the same one behind most public calculators, looks like this:
n = (Zα/2 + Zβ)² × [p1(1−p1) + p2(1−p2)] / (p1−p2)²

p1 = 0.010 (baseline)
p2 = 0.012 (target)
Zα/2 = 1.96 (95% confidence, two-tailed)
Zβ = 0.84 (80% power)

n = (1.96 + 0.84)² × [0.010×0.990 + 0.012×0.988] / (0.002)²
n = 7.84 × 0.021756 / 0.000004
n ≈ 42,700 sessions, per variant
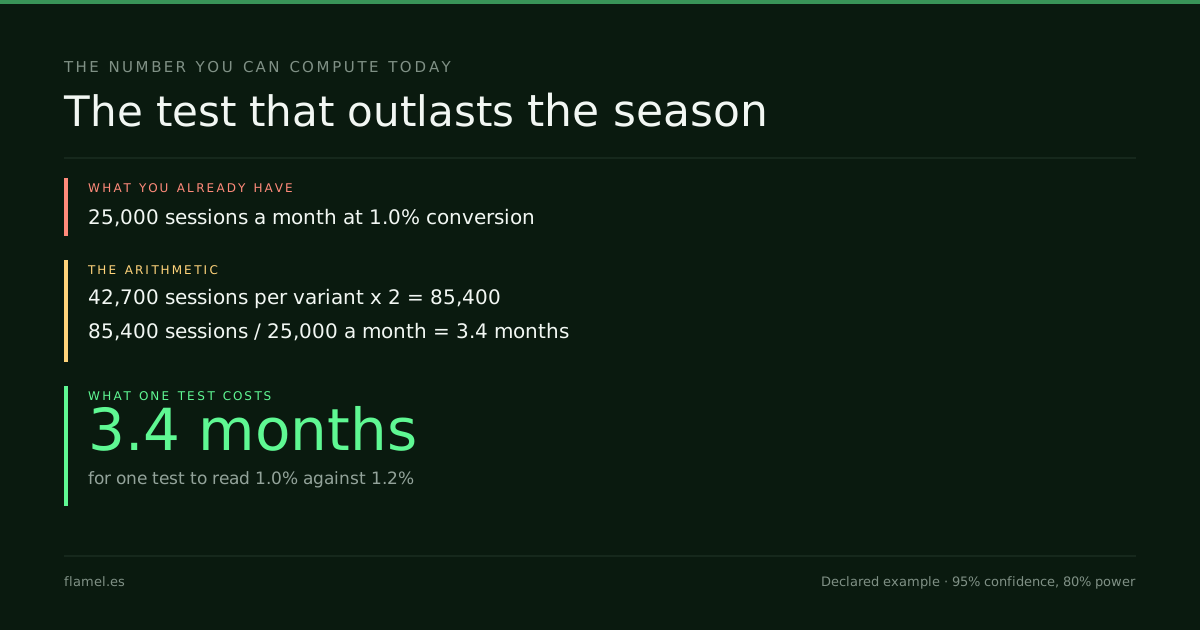
Two variants means 85,400 sessions before the test can legitimately call a winner. At 25,000 sessions a month, that's 85,400 ÷ 25,000 ≈ 3.4 months — for one test, on one page, testing one change.
A Conversion Audit ranks which changes are worth making first, before a store spends a season proving one of them statistically. That's a cheaper first step than running the clock on a test the traffic can't yet support.
For comparison, Redi Foods logged 130,465 sessions across the 22 months of its case, about 5,930 a month. At that pace, one variant of this same test would need over seven months to reach 42,700 sessions, and the full test close to fifteen. That is more than a year for one answer about one page.
What replaces A/B testing with low traffic while you read the data
Below the threshold, the fix is not a smaller test. It's a different kind of evidence, and a brand that sells in launches already has the best one: the launch itself. Change one variable per launch, and only one: the product page, the shipping threshold, the email that opens the drop. Then read that launch's buyers against the previous launch's buyers on the same numbers: conversion, average order, and how many came back. It isn't a randomized test and shouldn't pretend to be. It's a calendar of single changes, each read against the last, and customer cohort analysis is how that reading is done.
Between launches, read the sessions. Recordings and funnel data don't need statistical power; they need volume you likely already have, and Microsoft Clarity is free with no traffic limits, so the instrumentation was never the expensive part. The reading is. Nielsen Norman Group recommends five users for a qualitative usability study and at least 20 for statistically significant numbers: finding what's broken takes far fewer people than proving a lift. Testing anyway costs more than the wait. Stopping a test the moment it looks significant always increases the rate of false positives, and a store short of traffic is the one most tempted to stop early, which is exactly how a low-traffic test convinces a team of a lift that isn't there.
What a store does instead: watch 20-30 recorded sessions on the page in question, read where the drop-off concentrates in the funnel, and fix what's visibly broken before testing what's merely uncertain. That reading — what it finds, and what it's worth per hour spent — is covered in the UX audit.
The number for months, not confidence
The number that actually decides whether to test is not a p-value. It's months per test, and you can compute it with your own traffic:
Months per test = 2 × (sessions needed per variant) ÷ your monthly sessionsPlug in a 1.0% baseline and a 1.2% target, and the numerator is fixed at 85,400. A store at 10,000 sessions a month needs 8.5 months. A store at 50,000 needs 1.7. Then compare the answer with the season the test is meant to inform, about three months for a brand that sells in launches. If the test outlasts the season, its verdict arrives after the decision it was for, and the store at 25,000 sessions is already past that line at 3.4 months. Past it, the ecommerce conversion rate moves on launches read one change at a time and on the fixes a qualitative pass finds, not on a test queue. That's the comparison a CRO agency's retainer rarely spells out before billing for the test.
What to do by Monday: pull your last twelve months of sessions, divide by twelve, divide 85,400 by that number. If the answer fits inside your next season, scope the test. If it doesn't, pick the one variable your next launch will change, and open your session recordings while you wait for it. Growth without volume runs on a calendar, not a test queue.
Work through this with your own numbers
You are a conversion analyst deciding whether a planned A/B test is viable given current traffic. Use [your average monthly sessions], [your current conversion rate as a decimal], and [the minimum lift you want to detect, e.g. 0.002 for two-tenths of a point]. Apply the two-proportion sample size formula at 95% confidence and 80% power: for each variant, n = (1.96+0.84)^2 × [p1×(1-p1) + p2×(1-p2)] ÷ (p1-p2)^2, where p1 is your baseline rate and p2 is baseline plus the lift. Multiply n by two for both variants, then divide by [your average monthly sessions] to get the number of months the test would need to run. Show every step of the arithmetic plainly. State the final number of months. Compare it with [the length of your next selling season, in months]. If the test outlasts the season, recommend against testing and suggest changing one variable per launch, read against the previous launch's buyers, plus reviewing session recordings on the highest-friction pages; if it fits inside the season, scope the test.FAQ
How much traffic do I need to run an A/B test?
It depends on your baseline conversion rate and the smallest lift you want to detect, not a fixed number. As a reference point, detecting a lift from 1.0% to 1.2% conversion at 95% confidence and 80% power takes about 42,700 sessions per variant — 85,400 total for a two-way test. Lower baseline rates or smaller target lifts push that number higher, sometimes by a large multiple.
What does a sample size calculator for A/B testing actually tell me?
It converts your baseline rate, your target lift, and your confidence level into a required number of sessions per variant, using a two-proportion statistical formula. What it doesn't tell you is how long that sample size will take to reach at your real traffic — you have to divide it by your own monthly sessions to get a usable timeline.
What does statistical significance mean in A/B testing?
It means the difference between two variants is unlikely to be explained by random chance alone, at a confidence level you set in advance (95% is standard). It does not mean the difference is large, permanent, or worth acting on — only that it's probably real, given enough sessions to measure it.
What should I do instead of A/B testing if my traffic is too low?
Change one variable per launch and read that launch's buyers against the previous launch's, and read session recordings and funnel data in between. Both run on volume you already have, with no statistical threshold to clear. Watch where visitors drop off, fix what's visibly broken, and keep formal testing for when one test fits inside a season.
How long does an A/B test take to reach statistical significance?
Months per test equals twice the sessions needed per variant, divided by your monthly sessions. For a 1.0% to 1.2% lift at 95% confidence and 80% power, the numerator is about 85,400 sessions. A store with 25,000 monthly sessions needs roughly 3.4 months; a store with 10,000 needs about 8.5.
That's what the Conversion Audit is: five business days, $500, and you keep the map whether or not you hire us.
Your store, five days.
$500. Zero commitment. Yours either way.