
Reduce churn: what marketing spends refilling it
Reduce churn by pricing what marketing spends replacing departures. Calculate the acquisition burden and what one point is worth under stated assumptions.

To reduce churn, first price the acquisition effort spent replacing departures. A customer count can stay flat while marketing brings in new customers every month. The percentage alone does not show how much of that work buys replacement rather than growth.
This is a declared example, not a client result. The product has 1,100 paying customers at €60 a month. That is €66,000 in MRR and €792,000 in ARR. Four of every hundred customers leave each month: 44 departures. Marketing brings in 44 new paying customers, at an example CAC of €400. The customer base stays at 1,100.
Those inputs value replacement acquisition at €17,600 a month. One percentage point less monthly churn means 11 fewer customers to replace. The arithmetic gives product and marketing a shared planning number. It does not guarantee cash savings or prove which retention project will deliver that improvement.
To reduce churn, price the acquisition burden of replacing departures. In this declared example, 1,100 paying customers lose 44 each month. At €400 CAC, replacement acquisition is valued at €17,600 monthly. One percentage point less monthly churn values 11 fewer replacements at €52,800 annually, assuming a constant base, CAC and twelve-month improvement.
Key takeaways
- Replacement acquisition value is customer departures multiplied by the relevant CAC, distinct from lost subscription revenue.
- The declared example holds 1,100 paying customers flat by replacing 44 departures monthly at EUR 400 CAC: EUR 17,600 per month.
- Annualizing the replacement burden assumes the customer base, departure count and acquisition cost remain constant.
- One point less monthly churn values 11 fewer replacements at EUR 52,800 annually; cash savings depend on avoidable costs and timing.
- Product and marketing should compare evidence about departures, achievable improvement and full project cost before committing the next budget.
To reduce churn, start with a defined base
Customer churn measures losses from a defined paying-customer base over a stated period. Here the base is the 1,100 customers paying at the start of a month. Losing 44 of that group gives 44 ÷ 1,100 = four of every hundred. New customers do not dilute that denominator. Customers who join and leave within the same month need separate treatment.
The SaaS churn rate formula article explains the denominator. Monthly and annual windows answer different questions. Keep the window, contract population and definition consistent before comparing results; do not treat an annual rate as a monthly rate.
Logo churn counts customers; revenue churn measures recurring revenue lost. ChartMogul's guide distinguishes them because customers can pay different amounts. A single departure can therefore have very different customer and revenue effects. The calculation below uses customer departures, not lost MRR. On the same cohort and period, customer retention rate is the complement of customer churn. It is not the complement of net revenue retention.
Price the replacement bill before you reduce churn
Take the product above: 1,100 customers, 4% monthly churn, €400 CAC, declared for this example. Forty-four paying customers leave in the example month. Replacing them — getting the base back to 1,100 — costs:
44 customers lost × €400 CAC = €17,600 a month
€17,600 × 12 = €211,200 a year
That is an annualized replacement-acquisition value of €211,200 at the declared CAC. It assumes 44 departures and 44 replacements each month, a base held at 1,100 and unchanged acquisition economics. It is not the annual churn of a closed cohort. Without replacement, the base would shrink and the monthly count of departures would change.
The customer acquisition cost is the multiplier, not lost subscription revenue. This planning calculation assumes replacements have the same acquisition cost as the customers used to calculate CAC. If replacement channels or customer types differ, use their own costs.
Product and marketing can now discuss the same constraint. Marketing needs 44 new paying customers just to hold the base steady. Product can investigate why those departures happen. The economic value of improving retention belongs in that joint conversation, alongside the effort required to keep acquiring customers. The same trade-off appears in what product-led growth costs to run.
Possible experience breaks include signup, first-session value, time to first value and week two. Those are places to investigate, not a complete list of causes. Recurly distinguishes voluntary departures from involuntary payment failures. Billing failures, customer fit and changing needs can require different work.
The Activation Audit maps the signup and early-product experience against your data. It gives the team evidence about where that experience breaks. It does not assume every cancellation has an onboarding cause. The Activation Audit is five business days, $500, and the map is yours whether or not you hire us.

Replacement value is not automatically cash saved
The average CAC can include costs that do not disappear when acquisition slows. Stripe's CAC guide includes acquisition-related salaries, tools and agency fees alongside advertising. If your existing team brings in 11 fewer customers, its salary bill may stay unchanged. A lower replacement requirement can release team capacity without releasing the same amount of cash.
For a spending decision, separate costs you can actually avoid from capacity you can reassign. A reducible campaign budget belongs in the first group. Work your existing team can move toward growth belongs in the second. Both can matter; they are different benefits.
The €400 CAC is declared for this example. Before treating it as money saved, check the avoidable cost of the next replacement. The €211,200 annualized figure values the acquisition burden at historical CAC. It is not a claim that every euro could be removed from tomorrow's budget. This is why marketing and product need to price the same scenario together.
Why the monthly average hides the curve
A blended rate does not identify which customers leave or why. Compare acquisition cohorts over matched observation windows. A pattern concentrated in early customers suggests a different investigation from departures spread across mature accounts. Neither pattern proves a cause on its own. Product analytics, cancellation reasons and billing records provide different evidence.
Keep the size of each cohort beside its rate. Do not multiply a small cohort's churn by the whole customer base and call the result its cost. Count that cohort's actual departures and use its acquisition economics if they differ. A cohort analysis can focus the investigation; it does not select an intervention automatically.
The SaaS churn rate article is already live and explains cohort definitions. The next review should bring the acquisition team and product team together around those departures. Their decision is which problem to investigate first, what a plausible improvement is worth, and which costs or capacity that improvement could release.
What one point is worth, and the Monday number
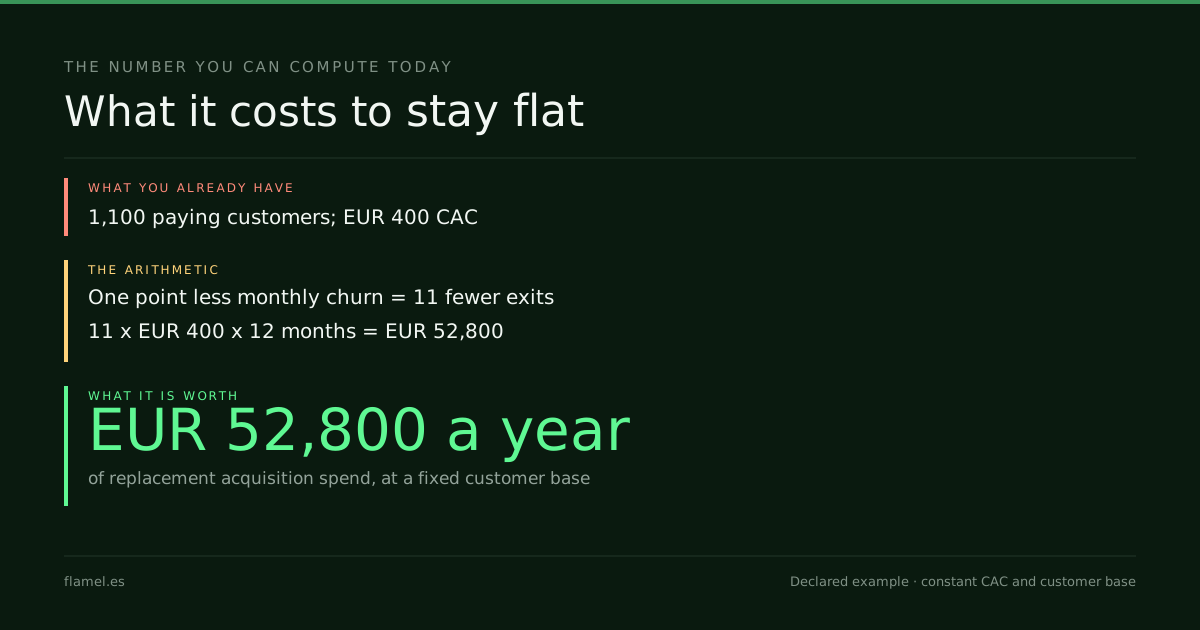
One point of monthly churn, on this product, is 11 customers — 1% of 1,100. Removing one point means 11 fewer customers to replace a month:
11 customers × €400 CAC = €4,400 a month
€4,400 × 12 = €52,800 a year
€52,800 is the annualized replacement-acquisition value of one percentage point under these assumptions. It is not automatically an investment ceiling or first-year savings. That reading would require the improvement to start immediately, persist all year and release the full €400 per avoided replacement. Ongoing delivery costs would also have to be included.
If the improvement arrives halfway through the year, only six months of replacement relief occur in that first year. If costs stay fixed, the benefit may be reassigned capacity. If marketing keeps acquisition unchanged, the benefit can be a larger customer base rather than a smaller acquisition bill. Those scenarios should not be added together as though they were independent savings.
For your next planning meeting, request the monthly departures, the starting customer base and the acquisition costs attached to replacement. Ask for an expected improvement and its delivery window. Separate cash that could be avoided from capacity that could be reassigned. Then compare the project's full cost with that conditional benefit.
On the declared example, keeping the base and CAC fixed makes one point worth 11 × €400 × 12 = €52,800 a year in replacement acquisition. That is the shared number to test before approving the work.
Work through this with your own numbers
You are reviewing a SaaS retention investment. Use [paying customers at the start of a month], [customers lost from that starting group during the month], [relevant acquisition cost per replacement], [monthly recurring revenue] and [the full cost of the proposed project]. Calculate customer churn and the acquisition value of replacing departures. Annualize only under an explicitly constant customer base and acquisition cost. Calculate the replacement value of one percentage point less monthly churn. Separate avoidable cash costs from fixed costs or capacity that could be reassigned. Use [months before the improvement starts] and [months the improvement is expected to persist] to price the first-year scenario. Do not promise that a project delivers one point or that historical CAC equals cash saved. List the evidence needed about cancellation causes and the expected improvement. Show the arithmetic, identify assumptions and compare the full project cost with the conditional benefit without recommending approval from the headline value alone.FAQ
What is a good SaaS churn rate?
There is no universal target for every SaaS product. Compare the same customer definition, contract population and period. For this decision, the declared four-of-every-hundred monthly rate identifies 44 departures from 1,100 starting customers. The acquisition value of replacing them is then a separate calculation. A benchmark does not determine the cause of those departures or the budget for fixing them.
How do you calculate customer churn rate?
Churn rate is customers lost during a period divided by customers you had at the start of it, usually run monthly: lose 44 of 1,100 customers in a month and churn is 4%. Logo churn counts accounts; revenue churn weights by what each account paid, so a single large cancellation can move revenue churn far more than logo churn even when only one name left.
What's the difference between logo churn and revenue churn?
Logo churn counts the number of accounts that cancel. Revenue churn weights each cancellation by what that account paid, so losing one enterprise account can move revenue churn much more than it moves logo churn. A product with low logo churn and revenue concentrated in a few large accounts can still be losing a dangerous share of revenue — the two numbers need to be read together, not interchangeably.
How much should it cost to reduce churn by one percentage point?
One percentage point of monthly customer churn is one percent of the starting customer base. Multiply that count by the relevant acquisition cost and the months the improvement is expected to hold. This gives a replacement-acquisition scenario. It is not an automatic project budget: avoidable costs, delivery timing, uncertainty and ongoing operating costs still need to be priced.
Does reducing churn grow revenue faster than acquiring more customers?
The answer depends on your customer economics and the improvement you can achieve. A retained customer may avoid replacement effort; a new customer may create additional revenue. Neither result is guaranteed, and retained customers do not necessarily expand. Compare contribution margin, acquisition cost, expected retention and the full intervention cost over a common window before choosing where the next budget goes.
The Activation Audit reads your onboarding, product analytics and lifecycle emails with real access. Five business days, $500, and the map is yours whether or not you hire us.
Your store, five days.
$500. Zero commitment. Yours either way.