Customer health score: how to build it to predict churn
Customer health score: the signals already in the product, how to check them against who left, and what saving 1 in 5 flagged accounts is worth.

A customer health score turns signals already in the product into a warning before an account leaves: how often it logs in, whether it uses the feature it paid for, whether its payments fail. Each account gets a number, and the ones below a line get flagged.
Building one is the easy part. It is only worth anything if it is checked against who actually left, and if someone acts on it: product on what to fix, marketing on whom to write to. A score nobody tested flags accounts that were staying anyway. A score nobody acts on is a dashboard.
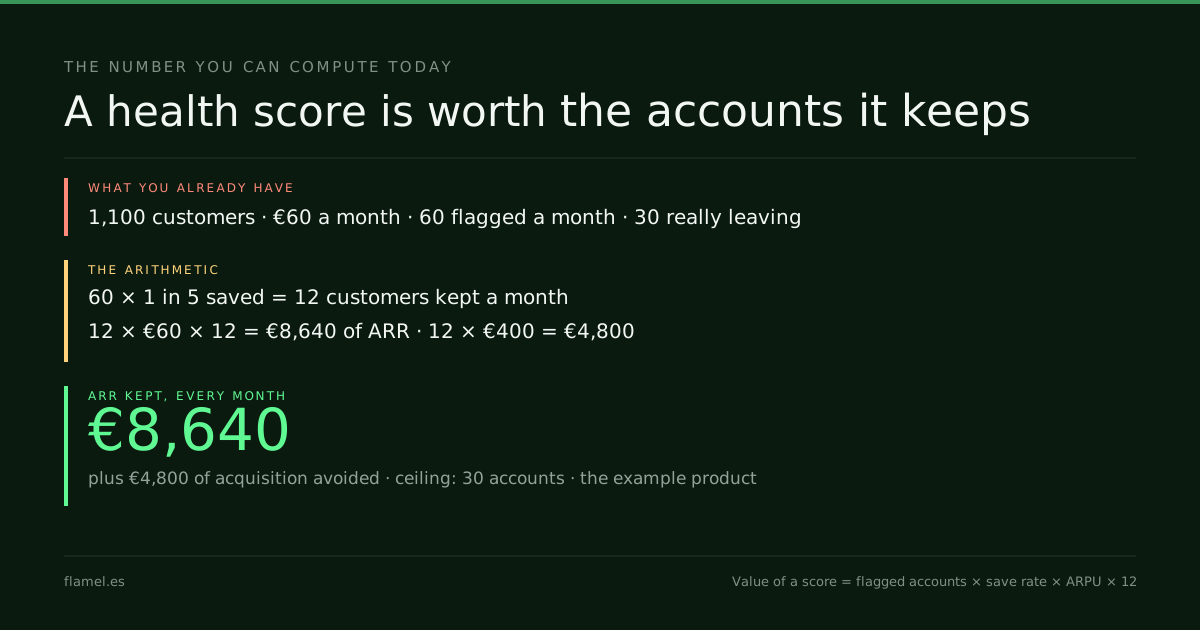
On a product with 1,100 customers at €60 a month, a score that flags 60 accounts a month and helps save 1 in 5 of them keeps 12 customers: €8,640 of ARR saved every month, and €4,800 of acquisition that does not have to refill the gap.
A customer health score weights product signals (usage, first value, depth, friction) into one number and flags accounts below a line. It only predicts churn once checked against who left. Flagging 60 accounts a month at €60 and saving 1 in 5 keeps 12 customers: €8,640 of ARR every month.
Key takeaways
- A customer health score weights signals already in the product, such as usage, first value, depth and friction, into one number per account.
- It predicts churn only after it is checked against who left: on the example, half of the 60 monthly flags were real.
- Saving 1 in 5 flagged accounts keeps 12 customers at €60: €8,640 of ARR every month and €4,800 of acquisition.
- In the EU, the save email is direct marketing: users can object, and the score needs an objection flag.
- Run your score over the last three months, count real flags and missed cancellations, and price the save with ARPU × 12.
The customer health score, in one line
Health score     = sum of (signal × weight), from 0 to 100
Flagged account  = an account below the threshold this month
Value of a score = flagged accounts × save rate × ARPU × 12
The signals come from the product, not from a survey. The weights say which ones matter more. The threshold decides how many accounts get flagged, and that decides how much work the score creates for the teams that have to act on it.
The last line is the one that matters. A score is worth the revenue it helps keep, and nothing before that.
Customer health score metrics: the signals already there
Most products already log what a score needs. Four signals cover most of it:
- Usage frequency. Active days in the last 14, against the account's own past. A drop matters more than a low number.
- The first value. Whether the account ever reached the outcome it signed up for, the moment time to value counts the days to.
- Depth. Seats used against seats paid, and whether the feature that justifies the plan is used at all.
- Friction. Open support tickets and failed payments in the last 30 days.
Forrester's guide to creating a customer health score starts there: “Not all metrics carry the same weight in every organization.” The weights are a first guess. The next step is what turns the guess into a warning.
Check the score against who actually left
Forrester's fourth step is to validate the model: “Apply historical data to the scorecard from accounts that were retained or churned.” The fifth is to keep doing it: “periodically retest it against customer results.”
That means running the score over the last few months, before anyone acts on it, and comparing its flags with the cancellations that followed.
Take the product this blog's SaaS posts use: 1,100 paying customers at €60 a month, €66,000 of MRR. Every month 4 of every 100 cancel, 44 customers, and the measure is the one in SaaS churn rate. Run the score over the last three months. The results below are declared for the example, not a client's numbers.
| Score checked against who left | Score never checked | |
|---|---|---|
| Accounts flagged a month | 60 | 60 |
| Flagged accounts that would have left | 30, half of the flags | Unknown |
| Cancellations it warned about | 30 of 44, about 2 in 3 | Unknown |
| Cancellations with no warning | 14 | Unknown |
| Most accounts a save can keep | 30 | Unknown: maybe 10 |
The column on the right is what a score looks like before anyone checks it. It flags 60 accounts too. If only 10 of them were going to leave, the team spends its month on 50 accounts that were staying anyway, and saving 12 is impossible.

What the customer health score is worth
Say the teams save 1 in 5 of the flagged accounts. That is 12 of the 60, and 12 of the 30 that were really leaving. The rate is declared for the example.
Customers kept      = 60 × 1/5         = 12 a month
MRR kept            = 12 × €60         = €720
ARR kept            = €720 × 12        = €8,640, every month
Acquisition avoided = 12 × €400        = €4,800 a month
Churn               = (44 − 12) ÷ 1,100 = 2.9 of every 100
The €400 is the acquisition cost the example product pays per customer, the same one SaaS LTV uses. Twelve customers kept is a little more than one point of churn, the move that post prices at €17,600 of lifetime margin for every monthly cohort.
The ceiling is the honest part of the arithmetic. A save rate can never exceed the share of flagged accounts that were really leaving. Here that is 30. Without the check against history, nobody knows the ceiling, and the €8,640 is a guess.
If you don't know which signals predict your cancellations, the Activation Audit maps where activation breaks before anyone builds a score on top of it.
Who acts on it: two lists
Forrester's guide says it directly: “There's no sense in measuring something if you are not going to take action as a result of the insight.”
A flag without an owner is a dashboard. Every flag should carry the signal that raised it, because the signal decides who acts:
- Product's list. Accounts that never reached the first value, or never used the feature their plan pays for. The fix is in the product: onboarding, the empty state, the path to that feature.
- Marketing's list. Accounts that were healthy and drifted. The fix is a message: what changed in the product since they last used it, and what they are not using.
Failed payments stay out of both. They are not a decision to leave, and billing fixes them.
Read each month, the two lists also say something the score cannot: which half of the problem is bigger. The customer retention rate tells the result. The lists tell where it comes from.
In the EU, the save email is direct marketing
When the score decides whom marketing writes to, that email is direct marketing, and European rules apply to it.
The EU's Your Europe portal on data protection and online privacy says that an existing customer can receive direct marketing emails “about their own similar products or services.” It also says: “You have the right to object at any time to receiving such direct marketing and the company have to stop using your data immediately.”
The GDPR goes one step further. Article 21(2), in the text as adopted, gives that right against processing “for such marketing, which includes profiling to the extent that it is related to such direct marketing.” Once someone objects, under Article 21(3), “the personal data shall no longer be processed for such purposes.”
So the score needs an objection flag next to it. A user who objected leaves marketing's list, and the value of the score counts only the accounts marketing may still write to. Product's list is not affected: fixing the onboarding is not a marketing email.
The customer health score number for your product
Value of a score = flagged accounts × save rate × ARPU × 12
Ceiling          = flagged accounts that really left, in the last three months
What to do by Monday: run your score, or the four signals above, over the last three months. Count how many flagged accounts canceled, and how many cancellations were never flagged. If half of the flags were real, multiply the flagged accounts by a save rate below that half, by ARPU and by 12. Put that number next to one month of acquisition spend, then split the flags into product's list and marketing's list before the first email goes out.
Work through this with your own numbers
You are a SaaS operator testing a customer health score before anyone acts on it. Inputs: [paying customers], [ARPU per month], [cancellations per month over the last three months], [accounts the score flagged per month over the same months], [flagged accounts that canceled within 60 days] and [acquisition cost per customer]. Calculate the share of flags that were real (flagged accounts that canceled ÷ flagged accounts) and the share of cancellations the score warned about. Set the ceiling: the flagged accounts that really left, per month. Then, for save rates of 1 in 10 and 1 in 5 of flagged accounts, calculate customers kept, MRR kept, ARR kept (MRR × 12) and acquisition avoided. Flag any save rate above the ceiling as impossible, and say which signal raised most of the real flags.FAQ
What is a customer health score?
A number from 0 to 100 built from signals already in the product: usage frequency, whether the account reached its first value, how much of the plan it uses and friction such as tickets or failed payments. Accounts below a threshold get flagged before they cancel.
What metrics go into a customer health score?
Usage frequency against the account's own past, whether it reached its first value, seats and features used against those paid, and open tickets or failed payments. The weights are a first guess until the score is checked against accounts that stayed or left.
How do you know if a health score works?
Run it over the last few months and compare its flags with the cancellations that followed. If half of the flagged accounts canceled and two in three cancellations were flagged, the score warns. If nobody checked, nobody knows how many flags were real.
How much is a customer health score worth?
Flagged accounts × save rate × ARPU × 12. On a product at €60 a month, 60 flags a month and 1 in 5 saved keep 12 customers: €720 of MRR and €8,640 of ARR every month, plus €4,800 of acquisition at €400 a customer.
Can a health score trigger marketing emails in the EU?
Existing customers can get direct marketing about similar products, but they can object at any time. Under GDPR Article 21, that objection covers profiling related to direct marketing. Keep an objection flag next to the score and leave those users off marketing's list.
If you don't know which signals come before your cancellations, the Activation Audit maps where activation breaks in five business days, for $500, and the map stays with you whether or not you hire anyone.
Your store, five days.
$500. Zero commitment. Yours either way.

Made between
Barcelona and Bogotá.
What’s holding your store’s sales back, in minutes.
Free, no card. Shopify stores for now.