Ecommerce funnel: 4 rates to baseline before the peak
An ecommerce funnel is four rates: cart, checkout, payment and conversion. How they multiply, where to read them, and why to baseline them before the peak.

An ecommerce funnel is the path from a visit to an order, read as four rates: the share of sessions that add to cart, the share of carts that reach checkout, the share of checkouts that pay, and the conversion rate those three multiply into. A store that only reads the day's revenue sees that orders fell. The funnel says at which step.
Each rate needs a baseline before the peak. On Black Friday there is no time to build one. After it, a drop has nothing to be compared against.
Below: the four rates, where to read them in Shopify, how they multiply on a worked store, and what one weak step costs in a peak month.
An ecommerce funnel is four rates: sessions that add to cart, carts that reach checkout, checkouts that pay, and the conversion rate they multiply into. At 4, 40 and 62.5 of every 100, that is 1 order per 100 sessions. In a 50,000-session month, a cart rate of 3 instead of 4 costs 125 orders and €8,500.
Key takeaways
- An ecommerce funnel is four rates: add to cart, cart to checkout, checkout to order, and the conversion rate the three multiply into.
- On the worked store, 4, 40 and 62.5 of every 100 multiply into 1 order per 100 sessions.
- In a 50,000-session month, a cart rate of 3 instead of 4 of every 100 costs 125 orders and €8,500.
- The same lost orders can come from the cart or from payment. Only a baseline for each step tells them apart.
- This week: export eight weeks of the four rates from one tool and save the table before the promotions start.
The ecommerce funnel as one multiplication
Every order passed three steps. The shopper added something to the cart, reached checkout and paid. Each step keeps a share of the one before it. Multiply the three shares and the result is the conversion rate. On the worked store below, the three steps take every 100 sessions down to 1 order.
Orders = sessions × cart rate × checkout rate × payment rate

cart rate       = sessions that add to cart ÷ sessions
checkout rate   = sessions that reach checkout ÷ sessions that add to cart
payment rate    = orders ÷ sessions that reach checkout
conversion rate = orders ÷ sessions = cart rate × checkout rate × payment rate
Shopify reports the same steps. It defines the added to cart rate as "the share of online store visits where a visitor added at least one item to the cart". Its checkout conversion rate is, "for visits that reached checkout, the share that completed a purchase" (Shopify).
One detail changes the arithmetic. Shopify's reached checkout rate divides by all visits, not by the visits with a cart. To get the step rate, divide it by the cart rate.
Step 1: the cart rate, the widest drop
Most shoppers leave here. On the worked store this blog uses, 4 of every 100 sessions add something to the cart. The other 96 look and leave.
This rate belongs to everything before the cart: the product page, the price, the photos, the stock and the delivery date. A drop here says the offer or the page stopped convincing. It says nothing about checkout.
Step 2: the checkout rate, the quiet leak
On the worked store, 40 of every 100 carts reach checkout. The other 60 stay in the cart, and most of those shoppers left no email to remind.
A drop here usually points at the cart itself: a shipping cost that shows up late, a minimum order, a discount code field that sends shoppers off to search for codes. The cart abandonment rate formula counts every cart that never becomes an order: 75 of every 100 on the same store.
Step 3: the payment rate, closest to the order
Of the shoppers who reach checkout, 62.5 of every 100 pay on the worked store. The rest leave at the form, the fees or the payment methods. Checkout optimization goes through those three.
These shoppers are the closest to the order, and usually the only ones who left an email. The checkouts that do not pay are the base of the abandoned cart recovery rate: 1,800 a year on the worked store.

Step 4: the conversion rate, the check
The fourth rate is the one most stores already watch: orders divided by sessions. It is the product of the other three.
4/100 × 40/100 × 62.5/100 = 1 order per 100 sessionsThat product is also a test of the tracking. If the three step rates do not multiply into the fourth, something is miscounted. Some sessions skip a step: a buy-now button that goes straight to checkout skips the cart. Or two tools got mixed, with sessions from one and carts from another. Read all four rates in one tool, over the same dates.
Ecommerce conversion rate explains why the fourth rate is compared with the store's own past, not with an industry average.
The ecommerce funnel on a worked store
The worked store has 300,000 sessions a year, a €68 average order and 45 of every 100 euros as margin. Its year runs like this:
300,000 sessions  × 4/100    = 12,000 carts
 12,000 carts     × 40/100   =  4,800 checkouts
  4,800 checkouts × 62.5/100 =  3,000 orders = €204,000
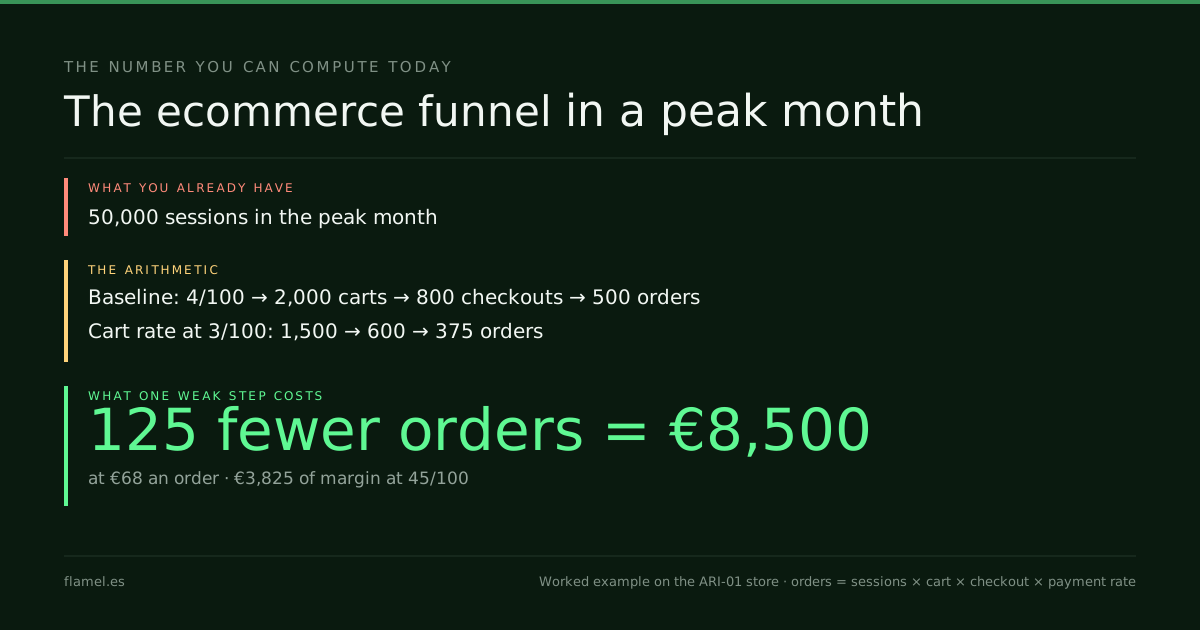
Its peak month brings 50,000 sessions. Say the cart rate slips from 4 to 3 of every 100 that month, and the other two steps hold.
Baseline:   50,000 × 4/100 = 2,000 carts → 800 checkouts → 500 orders
Cart at 3:  50,000 × 3/100 = 1,500 carts → 600 checkouts → 375 orders

Orders lost  = 500 − 375     = 125
Revenue lost = 125 × €68     = €8,500
Margin lost  = €8,500 × 0.45 = €3,825
The same 125 orders can go missing at another step. If carts and checkouts hold and only 375 of the 800 checkouts pay, about 47 of every 100, the month also ends at 375 orders. The revenue line looks identical. The fix does not: one is the product page, the other is payment. Only a baseline for each step tells the two apart.
Conversion funnel or ecommerce funnel: same four steps
A conversion funnel is the general name for any series of steps toward one goal: a sign-up, a lead, a booking. In an online store the goal is the order, and the steps are the cart, the checkout and the payment. The ecommerce funnel is that conversion funnel with the store's own steps. On the worked store it starts with 300,000 sessions a year and ends with 3,000 orders.
Baseline the ecommerce funnel before the peak
A baseline is the normal value of each rate, written down with its dates. It has to exist before Black Friday. During the peak there is no time to build one, and afterward a drop has nothing to be compared against.
- Pull the last eight weeks, week by week, from one tool.
- Write the four rates for each week, next to sessions and orders.
- Mark the normal range of each rate: its lowest and its highest week.
- Save the table with the date, before the promotions start.
During the peak, check each step against its range, not the day's revenue against last year's. A step outside its range is the first one to look at.
Andrés Ossa, CEO of Flamel, wrote on LinkedIn in October that the best way to decide what to test first is to review the user's journey and look for the friction closest to the moment of conversion. A funnel with a baseline is that journey in numbers. It shows which step moved, and how close it sits to the order.
Once the weak step is known, ecommerce conversion rate optimization maps where the revenue leaves and what to fix first.
The ecommerce funnel number for your store
Orders           = sessions × cart rate × checkout rate × payment rate
Orders lost      = baseline orders − orders with one rate changed
Revenue at stake = orders lost × average order
On the worked store, a cart rate of 3 instead of 4 of every 100 in a 50,000-session month costs 125 orders and €8,500.
What to do by Monday: export eight weeks of sessions, carts, checkouts and orders from the store's analytics. Write the four rates for each week in one table, with the date. That table is the baseline Black Friday gets read against.
Work through this with your own numbers
My online store had these numbers each week for the last eight weeks, all from [analytics tool]: [sessions], [sessions that added to cart], [sessions that reached checkout] and [orders]. My average order is [average order]. For each week, calculate the cart rate (carts ÷ sessions), the checkout rate (checkouts ÷ carts), the payment rate (orders ÷ checkouts) and the conversion rate (orders ÷ sessions). Check that the three step rates multiply into the conversion rate, and flag any week where they don't. Then give me the lowest and the highest week of each rate as its normal range. Finally, for next month's expected [sessions], calculate how many orders and how much revenue I would lose if the cart rate fell one point below its eight-week average while the other two rates held. Show every step of the arithmetic.FAQ
What are the stages of an ecommerce funnel?
In a store's analytics the stages are the session, the cart, the checkout and the order. Each stage keeps a share of the one before it: the cart rate, the checkout rate and the payment rate. Their product is the conversion rate.
How do you calculate an ecommerce funnel conversion rate?
Divide orders by sessions, or multiply the three step rates. If 4 of every 100 sessions add to cart, 40 of every 100 carts reach checkout and 62.5 of every 100 checkouts pay, both give 1 order per 100 sessions.
Is there a benchmark for each funnel step?
Published averages exist, but they mix stores with different prices, traffic and categories. The benchmark that helps during a peak is the store's own: eight weeks of each rate, with its normal range, saved before the promotions start.
What is the difference between a conversion funnel and an ecommerce funnel?
A conversion funnel is any series of steps toward one goal, such as a sign-up or a lead. An ecommerce funnel is the store's version: the goal is the order, and the steps are the cart, the checkout and the payment.
See how the Conversion Audit reads each step of your funnel: five business days, $500, and the map stays with the store.
Your store, five days.
$500. Zero commitment. Yours either way.

Made between
Barcelona and Bogotá.
What’s holding your store’s sales back, in minutes.
Free, no card. Shopify stores for now.