New vs returning customers: how to count them, by order
New vs returning customers, counted by order instead of by cookie: why analytics drifts in the EU, and what a peak's new buyers are worth.

New vs returning customers is the split of a period's buyers between people placing their first order and people who had ordered before. Counted by order, against each customer's order history, it tells a store who the peak really brought. Counted by browser, as analytics tools count it, a returning customer on a new phone looks new.
Black Friday is usually defended as acquisition. Read by order, the split can say otherwise: in the example below, 75 of the week's 120 orders come from customers the store already had. The new ones are worth what their second order is worth. That second order can only be measured if first-time and returning buyers are tagged before the peak, not reconstructed in February.
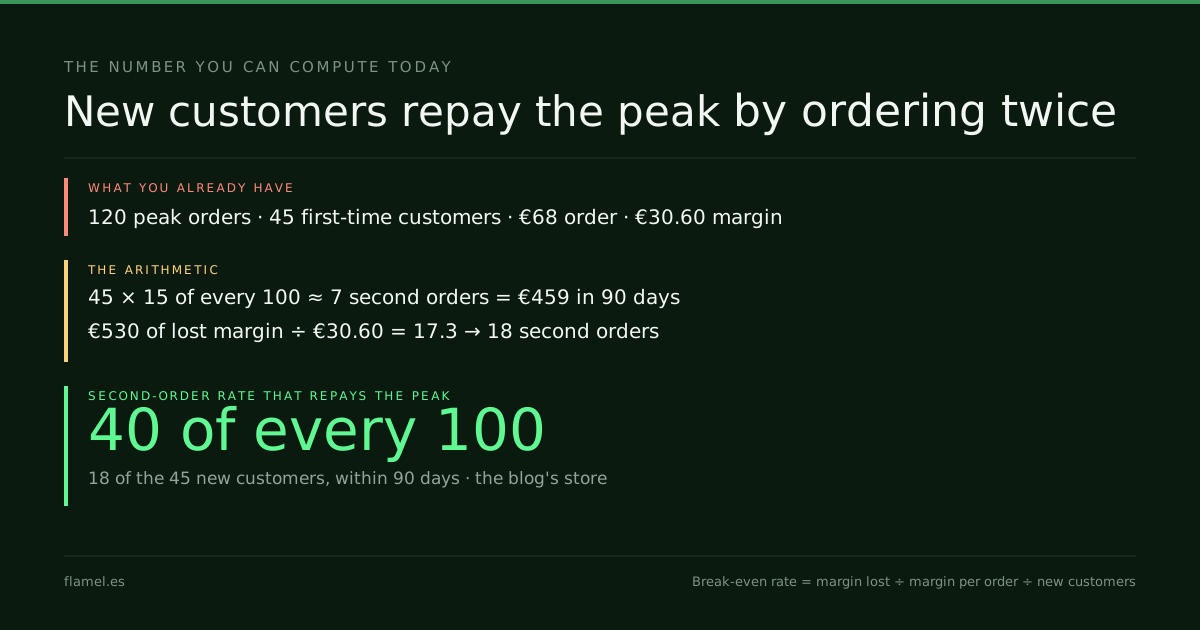
On a store with a €68 order, a Black Friday week of 120 orders brings 75 from returning customers and 45 from new ones. At 15 of every 100 ordering again within 90 days, the 45 bring about 7 second orders: €459. To repay the week's €530 of lost margin, 18 of the 45 would have to come back.
New vs returning customers splits a period's buyers into first orders and repeat orders. Count it from order history, not analytics cookies. On a Black Friday week of 120 orders at €68, 45 first-time customers at 15 of every 100 reordering within 90 days bring €459; repaying €530 of lost margin takes 18.
Key takeaways
- New vs returning customers is counted from order history; analytics counts browsers, so a returning customer on a new device looks new.
- In the EU, analytics cookies need consent first, so visitors who decline are never recognized as returning.
- On a 120-order Black Friday week, 75 orders from past buyers and 45 from new ones: 3 of every 8 are new.
- At 15 of every 100 reordering in 90 days, the 45 bring €459; repaying the week's €530 of lost margin takes 18 of them.
- Split last year's peak by customer type, count second orders within 90 days, and compare them with the promotion's margin cost.
New vs returning customers: two ways to count
The same week gives two different splits, depending on who is counting.
| Analytics: users by cookie | The store: customers by order | |
|---|---|---|
| What it counts | Browsers that visited | People who ordered |
| How a person is recognized | A random ID stored in a cookie | The customer's order history |
| Returning customer on a new device | Counted as new | Counted as returning |
| Visitor in the EU who declines analytics cookies | No cookie, so never recognized | Counted as returning if they order |
| The question it answers | Did this browser visit before? | Has this person bought before? |
| Verdict | A traffic number | The number for the peak |
Google describes its own method plainly. Its help page on users and sessions says: “Google Analytics creates a random, unique ID that gets associated with the user's browser cookie.” If that cookie is cleared, “Analytics will then count that user as ‘New,’ rather than ‘Returning.’” And it “doesn't recognize users who visit your website from different devices by default and will count each device as a unique user.”
Shopify counts the other way. Its customers reports define a first-time customer as “a customer who placed their first order with your store”, and a returning customer as one “whose order history already includes at least one order.” No cookie is involved. A customer who browses on a laptop and orders from a phone is still the same customer.
Why new vs returning users drift in the EU
In the EU, the cookie that analytics needs is not there by default. The EU's Your Europe portal on cookies and online privacy lists analytics among the uses that need consent, and says: “This means cookies cannot be set when the webpage is first opened.”
Google's own page on consent mode describes what happens when a visitor declines: “No Analytics cookies are set, accessed, or read from the device.” Some of the gap gets modeled, not observed.
So a loyal customer who declines the banner has no ID that survives the visit. Analytics cannot know they came back. The report of new vs returning users answers a traffic question, with gaps. The report of new vs returning customers answers the one the peak needs, from orders.

The peak's real mix, order by order
Take the store this blog uses for its eCommerce examples: 3,000 orders a year at €68, from 1,875 customers, the base of repeat purchase rate. Each order leaves €30.60 of margin. Its 20-off Black Friday week takes 120 orders, as in promotion incrementality.
Say 75 of those orders come from people who had ordered before, the same 75 that past buyers bring in Black Friday early access, and 45 come from first-time customers. One order each. The mix is declared for the example, not a client's numbers.
Black Friday week orders        120
From returning customers         75 × €68 = €5,100
From first-time customers        45 × €68 = €3,060
New share of the week's orders   45 ÷ 120 = 3 of every 8
The acquisition story says the week brought 45 new customers. The incrementality post says the same week lost €530 of margin over three weeks, once the dip that followed it is counted. The question for the CMO is whether those 45 pay it back.
What the new ones are worth: the second order
A first-time customer from a promotion is worth what they spend next. The window that settles it is short: 90 days, the same one customer cohort analysis uses to compare launches. Its two example cohorts placed second orders at 15 and 22 of every 100. Apply those rates, and the rate that would repay the promotion, to the 45:
| Second orders within 90 days | Second orders | Revenue | Margin |
|---|---|---|---|
| 15 of every 100 | 6.75 ≈ 7 | €459 | €207 |
| 22 of every 100 | 9.9 ≈ 10 | €673 | €303 |
| 40 of every 100 | 18 | €1,224 | €551 |
The break-even is one division: €530 ÷ €30.60 = 17.3 second orders, so 18 of the 45, or 40 of every 100. That is almost twice the better launch cohort.
And it is the generous reading. It credits the promotion with all 45 new customers, though a normal week brings first-time buyers too. It also prices every second order at full price, when some may wait for the next code.
None of this says the peak was a mistake. It says the peak's new customers are a bet that pays only through the second order, and that bet has a number.
Knowing where first-time buyers stop before that second order is part of what the Conversion Audit maps, before the next peak's traffic arrives.
Tag them before the peak
The split has to exist the day the orders arrive. Reconstructed in February, it mixes the peak's buyers with January's, and the 90 days have already started.
Three things make the second order measurable:
- A customer type on every peak order: first-time or returning, from the order history, not from analytics.
- A list of the peak's first-time customers, with the date of their first order and the offer they used.
- One cohort row for the peak, next to the launch cohorts, followed for the same 90 days.
With that in place, the January report can say how many of the 45 came back, not how many browsers did.
The new vs returning customers number for your store
New share of peak orders = orders from first-time customers ÷ peak orders
Value of the new ones    = new customers × second-order rate in 90 days × average order
Break-even rate          = margin the promotion lost ÷ margin per order ÷ new customers
What to do by Monday: take last year's peak week from the order export. Split its orders by customer type. Count how many first-time customers placed a second order within 90 days. Multiply by the average order. Then put that number next to what the promotion cost in margin. If the break-even rate is far above last year's, tag this year's buyers before the peak, and plan the second order before the first one ships.
Work through this with your own numbers
You are an ecommerce analyst reviewing last year's peak. Inputs: [orders in the peak week], [orders from first-time customers], [orders from returning customers], [first-time customers who placed a second order within 90 days], [average order value], [margin per order] and [margin the promotion lost, including the dip after it]. Calculate the new share of peak orders as first-time orders ÷ peak orders. Calculate the 90-day second-order rate of the peak's new customers, and the revenue and margin of those second orders. Then calculate the break-even rate: margin lost ÷ margin per order ÷ new customers. Compare the actual rate with the break-even rate and say how far apart they are. Use the order history for customer type, never analytics users, and list anything that could inflate the count of new customers.FAQ
What is the difference between new and returning customers?
A new customer is placing a first order with the store. A returning customer already has at least one order in their history. The split is counted from orders and customer records, so the same person stays the same customer on any device.
Why don't Google Analytics and Shopify agree on new vs returning?
They count different things. Analytics recognizes a browser through a cookie, so a cleared cookie or a new device makes a returning customer look new. Shopify reads the customer's order history. For the peak, the order count is the one to use.
Does cookie consent affect new vs returning users?
Yes, in the EU. Analytics cookies need consent before they are set. When a visitor declines, no analytics cookie is stored, so the tool cannot recognize them on the next visit. The order history still can, if they buy.
How do you know if Black Friday customers come back?
Tag each peak order as first-time or returning, keep the list of first-time customers, and follow them as one cohort for 90 days. On a week with 45 new customers, 15 of every 100 returning means about 7 second orders, worth €459.
What ratio of new to returning customers is good?
There is no universal one. Compare the peak against the store's normal weeks and against last year's peak, counted the same way. The ratio matters less than how many of the new customers place a second order.
Before the peak's new customers go quiet, know where the second order gets lost. The Conversion Audit maps where the store loses customers in five business days, for $500, and the map stays with you whether or not you hire anyone.
Your store, five days.
$500. Zero commitment. Yours either way.

Made between
Barcelona and Bogotá.
What’s holding your store’s sales back, in minutes.
Free, no card. Shopify stores for now.