
NPS for SaaS: the score against who stays
NPS for SaaS: how the score is calculated, what a good one is, and what each group is worth once you cross the survey with who actually stays.

NPS for SaaS is the Net Promoter Score of a software product. Customers rate how likely they are to recommend it on a scale from 0 to 10, and the score is the share of promoters minus the share of detractors, anywhere from -100 to +100. Software companies average around 47 to 51. The score says who would recommend the product; it does not say who stays.
That gap is why NPS so often becomes a trophy. It goes on a slide, moves a few points a quarter, and nobody can say what a point is worth. Joined to retention, the same survey does a different job: each group of customers gets its own churn rate, and moving a group one step gets a price in recurring revenue.
NPS for SaaS is the share of customers who would recommend the product (9 or 10) minus the share who would not (0 to 6). A good SaaS score is around 47 or higher. The score does not say who stays: crossed with cancellations, each group gets a churn rate and a price in recurring revenue.
Key takeaways
- NPS for SaaS is the share of promoters minus the share of detractors; a good SaaS score is around 47 or higher.
- The score says who would recommend the product, not who stays, and passives count for nothing in it.
- Crossed with cancellations, each group gets its own churn rate: on the example product, 2, 4 and 8 of every 100 a month.
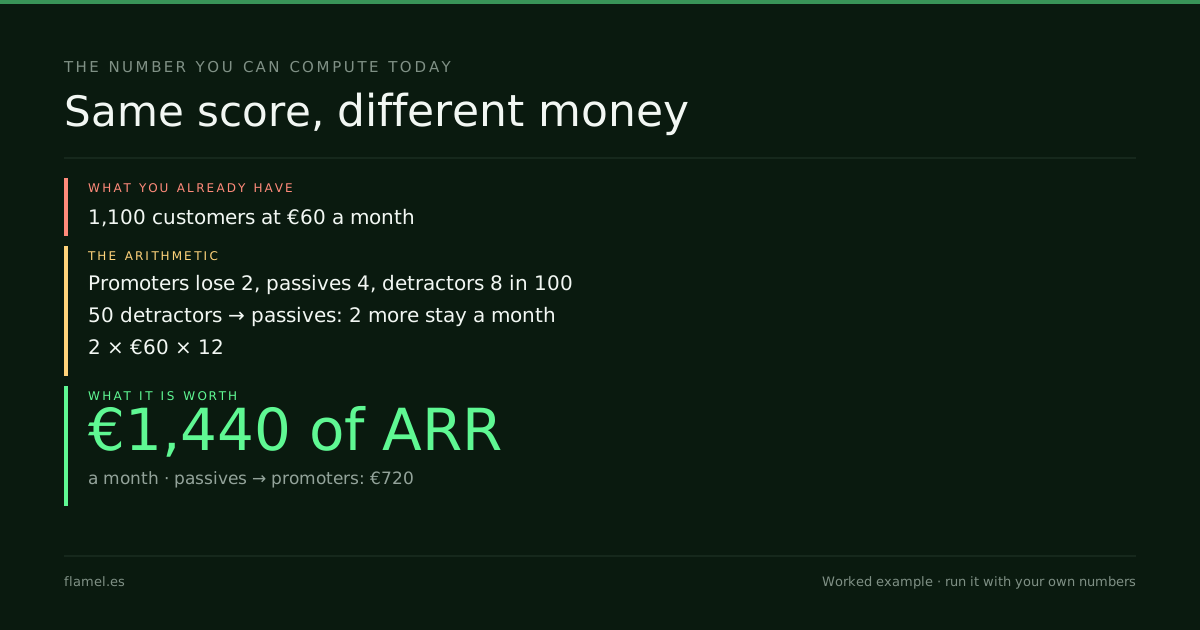
- Moving 50 detractors to passive and 50 passives to promoter raise the score the same 4.5 points, but are worth €1,440 and €720 of ARR a month.
- Report churn by group, the value of one step and the main reason beside the score, so NPS becomes a decision.
How NPS for SaaS is calculated
Bain & Company, which created the score, starts from one question: how likely is the customer to recommend the company to a friend or colleague, on a zero-to-ten scale. The answers fall into three groups:
- Promoters (9 or 10). Bain describes them as "loyal, enthusiastic fans" who are "far more likely than others to remain customers and to increase their purchases over time."
- Passives (7 or 8). "Passively satisfied," in Bain's words: satisfied for now, and open to a competitor's offer.
- Detractors (0 to 6). Unhappy customers who "have high rates of churn and defection."
NPS = share of promoters − share of detractorsPassives count for nothing in the score. A product where 40 of every 100 respondents are promoters and 20 of every 100 are detractors scores +20, whatever the other 40 are doing.
For a benchmark, CustomerGauge puts a good NPS for SaaS companies at "typically 47 or higher," with the software and technology sector averaging 51 in its 2026 survey and 47 across a decade of editions.
What the score does not say
The score was built to predict growth, not retention. Frederick Reichheld introduced it in Harvard Business Review in 2003 as "the one number you need to grow," arguing that "the best predictor of top-line growth can usually be captured in a single survey question." The article's subtitle went further: "If growth is what you're after, you won't learn much from complex measurements of customer satisfaction or retention." For a subscription product, where growth is the revenue that arrives minus the revenue that leaves, that is half of the picture.
Bain's own definitions are about behavior: who stays, who buys more, who leaves. The score keeps none of it. It nets two groups into one number and drops the third, so two products with the same NPS can lose customers at very different rates, and the same product can raise its score without keeping one more customer.
Even the benchmark vendors point the other way from the trophy. CustomerGauge's advice is to "tie your NPS score to the value of the account," so the team can act before a valuable customer leaves. That is the step most SaaS teams skip: the survey goes to the customer success team, the churn report goes to finance, and nobody puts the two side by side.

NPS for SaaS, joined to who stays
Take the product used across this blog's SaaS posts: a subscription tool for creative businesses such as studios, academies and photographers, with 1,100 paying customers at €60 a month, the base worked out in the SaaS pricing strategy post. It loses 4 of every 100 customers a month, 44 in all, the SaaS churn rate that keeps it flat.
The cross needs no new tool. Each survey response belongs to an account, and billing knows which accounts are still paying. Match the two, wait a window long enough to see the decision (90 days is a reasonable start on a monthly plan) and count who left in each group. A group with fewer than about 50 responses reads as a direction, not a rate.
Here is what the last NPS survey looks like crossed with the cancellations since (the split by group is a declared example):
| Group | Customers | Lost each month | Customers lost |
|---|---|---|---|
| Promoters | 440 | 2 of every 100 | 8.8 |
| Passives | 440 | 4 of every 100 | 17.6 |
| Detractors | 220 | 8 of every 100 | 17.6 |
| All customers | 1,100 | 4 of every 100 | 44 |
The score is +20, well below the sector benchmark. The table says more than the score does. Detractors are 1 in 5 customers and 2 in 5 of the monthly losses. Passives, who count for nothing in the NPS, lose exactly as many customers as the detractors do. And the promoters still lose almost 9 a month: recommending a product and renewing it are not the same decision.
Two moves, same score, different money
Group value = customers moved × churn gap × ARPU × 12Suppose next quarter's work can move 50 customers one step up. There are two ways to spend it:
- 50 detractors become passives. The churn gap is 8 − 4 = 4 of every 100, so 2 more customers stay each month. At €60 a month that is 2 × €60 × 12 = €1,440 of ARR for every month the change holds. The NPS goes from +20 to +24.5.
- 50 passives become promoters. The gap is 4 − 2 = 2 of every 100, so 1 more customer stays each month: €720 of ARR. The NPS also goes from +20 to +24.5.
Same 4.5 points on the slide; one move is worth twice the other. A team that is judged on the score will pick whichever is easier, and the passives are usually easier to please. A team that is judged on who stays starts with the detractors, and with the reason they gave.
Crossing your last NPS survey with the cancellations since, and putting a price on each group, is part of what The Activation Audit maps.
What to do with the score next quarter
Keep the survey and change what gets reported next to it. Three numbers turn NPS from a trophy into a decision:
- Churn by group, from the survey responses matched to who cancelled in the following 90 days.
- The value of one step for each group, with the formula above.
- The most common reason behind the group worth the most, in the customers' words.
The reason is where the other listening posts of this series come in. The product-market fit survey asks who would miss the product; jobs to be done examples explain why two customers on the same plan stay for different lengths of time. NPS by group adds the price. And a score that cannot be priced makes a weak north star metric: it moves, and nobody knows what it moved. The number to sit beside it is the customer retention rate of each group.
What to do this week: export your last NPS survey, mark which respondents are still paying today, and calculate the monthly churn of promoters, passives and detractors. Then multiply 50 customers by the gap between detractors and passives, by your ARPU and by 12. That is what the next quarter's survey work is worth.
Work through this with your own numbers
My SaaS product has [paying customers] paying customers at [ARPU] a month. In my last NPS survey, [number] answered 9 or 10, [number] answered 7 or 8 and [number] answered 0 to 6. Of each group, this many have cancelled since: [promoters lost], [passives lost], [detractors lost], over [months] months. Calculate my NPS, the monthly churn of each group and what moving 50 customers one step up is worth in ARR for each move (customers moved times the churn gap times ARPU times 12). Tell me which move is worth more, how much each one changes the score, and what to ask the group worth the most in my next survey.FAQ
What is a good NPS for SaaS?
CustomerGauge puts a good NPS for SaaS companies at 47 or higher, with the software and technology sector averaging 51 in its 2026 survey. A more useful benchmark is your own product: the churn of each group, and whether the groups worth the most are growing.
How is NPS calculated?
Customers answer how likely they are to recommend the product on a scale from 0 to 10. Promoters answer 9 or 10, passives 7 or 8 and detractors 0 to 6. The score is the share of promoters minus the share of detractors, so it runs from -100 to +100 and passives do not count.
Does NPS predict churn in SaaS?
The groups do; the score alone does not. Detractors usually cancel at a higher rate than promoters, but two products with the same score can lose customers at very different rates. Match each response to whether the account is still paying a few months later and you get a churn rate per group.
Why do passives matter if they do not count in the score?
Because they can be as many as the promoters and still leave at the average rate. On the example product above, 440 passives lose as many customers each month as 220 detractors do, and none of it shows up in the NPS.
Joining your NPS responses to who actually stays, and pricing each group in recurring revenue, is part of what The Activation Audit maps. Five business days, $500, and the map stays with you whether or not you hire anyone next.
Your store, five days.
$500. Zero commitment. Yours either way.