SaaS metrics: how to read the 7 that matter most
Seven SaaS metrics for the year-end read: ARR, net new MRR, churn, NRR, CAC, payback and LTV:CAC, each defined and worked on one product.

SaaS metrics are many, but the year-end read needs seven: ARR, net new MRR, customer churn, net revenue retention, CAC, CAC payback and LTV:CAC. Marketing owns the ones about what comes in and what it costs. Product owns the ones about who stays and who grows. Each one, read alone, can look healthy while the product stands still. Read on one page, they show whether the product grew or only replaced the customers it lost.
The habit runs the other way. Writing on LinkedIn about NPS, Andrés Ossa, Flamel's CEO, described the usual path of a metric: the team keeps the number, and it goes into the dashboards and the reports. Seven numbers in seven dashboards tell seven separate stories.
Below: each of the seven, with what it is, how to read it and its value on one worked product. Then the seven together, and the one number that crosses them.
The SaaS metrics worth reading at year-end are seven: ARR, net new MRR, customer churn, net revenue retention, CAC, CAC payback and LTV:CAC. On a product with 1,100 customers at €60, they show €660 of net new MRR against €17,600 of monthly acquisition spend: €26.7 per euro of growth.
Key takeaways
- Seven SaaS metrics cover the year-end read: ARR, net new MRR, customer churn, net revenue retention, CAC, CAC payback and LTV:CAC.
- Marketing owns what comes in and what it costs. Product owns who stays and who grows. Only read together do they show real growth.
- On the example product, 44 customers arrive and 44 leave each month, and all €660 of net new MRR comes from upgrades, net of downgrades.
- A monthly NRR of 97 in 100 looks top quartile against yearly benchmarks. Over twelve months it is 69, below ChartMogul's median of 82 for business software.
- This week: divide last month's acquisition spend by its net new MRR, and compare it with the same figure a quarter ago.
How to read SaaS metrics: one product
Every number below comes from the same example product this blog uses. It has 1,100 customers paying €60 a month. Each month 44 new customers arrive and 44 leave, 4 of every 100. Upgrades add €1,320 of monthly revenue and downgrades take away €660. Gross margin is 80 of every 100 euros. The example spends €17,600 a month on acquisition, a declared figure.
Each metric gets three lines: what it is, how to read it and what it shows on this product. The point of using one product for all seven is that the numbers have to agree with each other. On separate dashboards, they never have to.
1. ARR: the base
What it is. Annual recurring revenue is recurring MRR times twelve. Stripe defines MRR as "the sum of the monthly-normalized value of all your active and past_due subscriptions", and its calculation excludes "any taxes applied to the subscription, any subscribers on free plans, and any metered (usage based) products" (Stripe).
How to read it. ARR is the base every other number is measured against. It is not MRR: a month's movement is twelve times larger in ARR, so a plan built on ARR has to say which one it means.
On the example product. €66,000 of MRR × 12 = €792,000 of ARR.
2. Net new MRR: the month's growth
What it is. New MRR plus expansion, minus churned MRR and contraction. Stripe describes MRR growth the same way: starting MRR plus new, reactivation and expansion MRR, "subtracting any contraction MRR and any churn MRR".
How to read it. Split it before reading the total. The same net figure can come from strong acquisition covering heavy churn, or from a stable base that keeps upgrading. The two need opposite plans.
On the example product.
New         = 44 × €60 = €2,640
Expansion   =            €1,320
Churned     = 44 × €60 = €2,640
Contraction =            €660
Net new MRR = 2,640 + 1,320 − 2,640 − 660 = €660 a month
New and churned cancel out. Every euro of growth comes from customers who upgraded, net of those who downgraded. Net new MRR works the split month by month.
3. Customer churn: who leaves
What it is. Customers lost in the month divided by customers at the start of it.
How to read it. The denominator decides the number. Stripe's subscriber churn rate divides churned subscribers by "the number of active subscribers 30 days ago, plus the total new subscribers in the past 30 days". Adding the new customers to the base makes the same losses look lower.
On the example product. 44 ÷ 1,100 = 4 of every 100 a month. Counted with the 44 new customers in the denominator, 44 ÷ 1,144 = 3.8 of every 100. Same product, same losses. SaaS churn rate explains the denominator that flatters it, and customer retention rate reads the other side: 96 of every 100 customers stay each month.
4. Net revenue retention: who grows
What it is. ChartMogul defines it as the share of "recurring revenue retained from a group of customers over time, after accounting for expansion, contraction, and churn" (ChartMogul).
How to read it. Check the period before comparing. ChartMogul's benchmark is yearly: in its December 2025 analysis of 3,500 software companies, median NRR for software sold to businesses was 82 of every 100, and the top quartile reached 97.
On the example product.
Monthly NRR = (66,000 + 1,320 − 660 − 2,640) ÷ 66,000 = 97 of every 100
Yearly NRR  = 0.97 ^ 12                              = 69 of every 100
Read against the yearly table, a monthly 97 looks like the top quartile. If the month repeats, the year ends at 69, below the median. Net revenue retention works out what one more point of expansion is worth.

5. CAC: what a customer costs
What it is. Acquisition spend in a period divided by the new customers it brought.
How to read it. CAC says what a customer costs to win, not whether the customer stays. A CAC that falls while churn rises is not good news.
On the example product. €17,600 ÷ 44 = €400 per new customer. At 44 lost a month, the same €17,600 is also the cost of standing still: €211,200 a year only to stay at 1,100 customers, as reduce churn counts it.
6. CAC payback: when it pays back
What it is. CAC divided by the monthly gross margin of one customer.
How to read it. The formula assumes the customer stays until it is paid back. Churn breaks that assumption, so the payback of a cohort is later than the payback on paper.
On the example product.
Payback on paper = €400 ÷ (€60 × 0.8) = 8.3 monthsLosing 4 of every 100 a month, 29 of every 100 customers in a cohort leave before month 8.3, and the cohort as a whole pays back in month 10. CAC payback period works the cohort month by month.
7. LTV:CAC: what a customer returns
What it is. Lifetime value, the gross margin a customer brings before leaving, divided by what it cost to win.
How to read it. LTV rests on churn: one point less, from 4 to 3 in every 100, raises it by a third. Read it with the churn line next to it.
On the example product.
LTV     = €60 × 0.8 ÷ 0.04 = €1,200
LTV:CAC = €1,200 ÷ €400    = 3
At 3 of every 100 lost a month instead of 4, LTV is €1,600 and the ratio is 4. SaaS LTV shows what that point is worth across a month of new customers.
The seven SaaS metrics on one page
| Metric | Example product | Owner |
|---|---|---|
| ARR | €792,000 | Both teams |
| Net new MRR | €660 a month | Both teams |
| Customer churn | 4 of every 100 a month | Product |
| Net revenue retention | 97 of every 100 a month, 69 a year | Product |
| CAC | €400 | Marketing |
| CAC payback | 8.3 months on paper, month 10 with churn | Marketing and product |
| LTV:CAC | 3 | Both teams |
One at a time, most of these pass. Payback under a year. LTV three times CAC. A monthly NRR that sits next to the top quartile.
Together, they tell another story. 44 customers come in and 44 leave. All the growth comes from upgrades. The product spends €17,600 a month to replace the customers it loses, and the €660 it adds each month is what is left over.
One line crosses the seven:
Acquisition spend per euro of net new MRR = €17,600 ÷ €660 = €26.7Each euro of monthly growth costs €26.7 of acquisition. If every month repeats, MRR ends the year €7,920 higher: €95,040 of ARR, 12 of every 100 on top of €792,000.
See what the Activation Audit reads in five business days.
Who owns each SaaS metric: both teams
Marketing reports new customers and CAC. Product reports churn, retention and expansion. Payback and LTV:CAC sit between the two, and the €26.7 belongs to nobody.
That is where the plan for next year usually breaks. Marketing is asked for more new customers, which raises the spend. Product is asked for lower churn, which nobody prices in euros of acquisition. A north star metric both teams sign is one way to close it. The cross number is a shorter one: one figure, two owners.
It also changes the conversation in the planning meeting. Asked separately, marketing defends its CAC and product defends its churn, and both numbers can be fine. Asked about the €26.7, each team has to explain its half of the same line, because a change on either side moves it.
Two ways to lower the cross number
The plan for next year can attack the €26.7 from either side. On the example product, both are easy to count.
More acquisition: 88 new a month at €400 = €35,200 of spend
  Net new MRR = 88 × €60 + 1,320 − 2,640 − 660 = €3,300
  Spend per euro of net new MRR = €35,200 ÷ €3,300 = €10.7

One point less churn: 33 lost a month instead of 44
  Net new MRR = 2,640 + 1,320 − 33 × €60 − 660 = €1,320
  Spend per euro of net new MRR = €17,600 ÷ €1,320 = €13.3
The first moves the number further. It also costs €17,600 more every month, and only if CAC holds at €400 while spend doubles. The second doubles net new MRR without one more euro of acquisition, and the 11 customers who stay keep paying the month after, and the one after that.
Neither lever is right on its own. What changes is that both are now in the same unit, euros of acquisition per euro of growth, so the two teams can compare them before the budget is set rather than after.
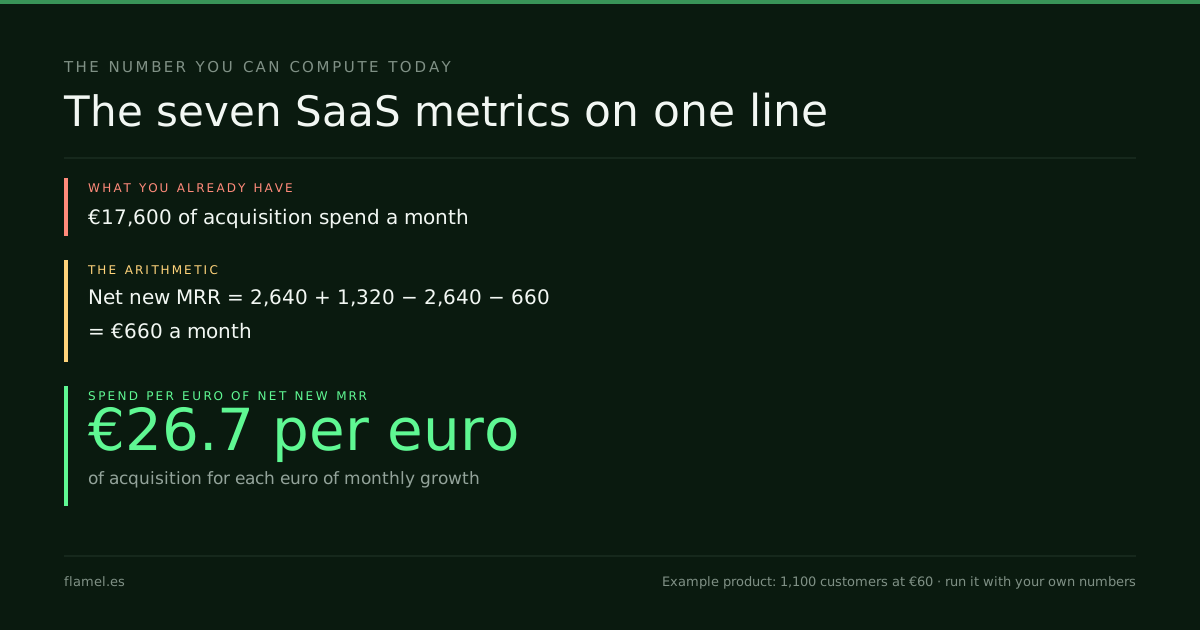
The number for your product
Net new MRR = new + expansion − churned − contraction
Acquisition spend per euro of net new MRR = monthly acquisition spend ÷ net new MRR
If net new MRR is zero or negative, the line has no answer: all of the spend is going to replacement. If it rises from one quarter to the next, growth is getting more expensive, whatever the other six say. If it falls, check which side moved: a cheaper CAC, more expansion, or fewer customers lost. Only the last two keep working once the spend stops.
What to do by Monday: put last month's seven numbers on one page, all from the same billing data, with the team that owns each one next to it. Then divide acquisition spend by net new MRR, and compare it with the same figure a quarter ago.
Work through this with your own numbers
My SaaS product has [customers] paying customers at an average of [ARPU] a month and a gross margin of [margin per 100] euros for every 100 euros of revenue. Last month [new customers] customers joined, [lost customers] left, upgrades added [expansion MRR] and downgrades took away [contraction MRR]. Acquisition spend was [acquisition spend]. Calculate seven metrics: MRR = customers × ARPU and ARR = MRR × 12; net new MRR = new × ARPU + expansion − lost × ARPU − contraction; customer churn = lost ÷ customers at the start; monthly NRR = (MRR + expansion − contraction − lost × ARPU) ÷ MRR, and the same raised to the 12th power for a year; CAC = acquisition spend ÷ new customers; CAC payback = CAC ÷ (ARPU × margin); LTV = ARPU × margin ÷ churn, and LTV ÷ CAC. Then divide acquisition spend by net new MRR. Put the eight numbers in one table with the team that owns each, and show every step.FAQ
What are the key SaaS metrics?
For a year-end read, seven: ARR, net new MRR, customer churn, net revenue retention, CAC, CAC payback and LTV:CAC. Together they show what comes in, what it costs, who stays and who grows, on the same billing data.
What is the difference between ARR and MRR?
ARR is recurring MRR times twelve: only revenue that repeats counts, so taxes, free plans and one-off charges stay out. A month's movement is twelve times larger in ARR, so €660 of net new MRR is €7,920 of ARR.
What is a good net revenue retention for SaaS?
ChartMogul's December 2025 analysis of 3,500 software companies put the median for software sold to businesses at 82 of every 100 a year, and the top quartile at 97. Compare a yearly figure with yearly benchmarks: a monthly 97 is 69 a year.
Which SaaS metrics should marketing and product share?
Net new MRR, because it holds both teams' numbers: new customers from marketing, churn and expansion from product. Dividing acquisition spend by it gives one figure that neither team can move alone.
See how the Activation Audit reads these seven on your product: five business days, $500, and the map stays with the team.
Your store, five days.
$500. Zero commitment. Yours either way.

Made between
Barcelona and Bogotá.
What’s holding your store’s sales back, in minutes.
Free, no card. Shopify stores for now.